Figure 4. The confinement domains for Ca2+ channel movements on bipolar cell terminals in the inner plexiform layer (IPL) were expanded by disrupting actin but not
by depleting membrane cholesterol. A: Three quantum dots (QDs) labeling individual Ca2+ channels in the IPL (arrows). Diffuse autofluorescence is also visible in the inner and outer plexiform layers. Scale bar=10
μm. B: MSD versus time interval for movements of individual Ca2+ channels in the IPL (n=34; filled circles). Confinement areas were calculated by fitting the data with Equation 3 (L=0.393±0.00237
μm). QDs immobilized in vacuum grease showed a small amount of jitter (L=0.0164±0.00447 μm, n=9; open circles). C: Actin disruption with cytochalasin D (20 μM) significantly expanded Ca2+ channel confinement domains relative to control (L=0.517±0.00680 μm, n=35, p<0.05; filled circles) but cholesterol depletion
with MβCD (10 mM) did not (L=0.409±0.00252 μm, n=16; triangles).
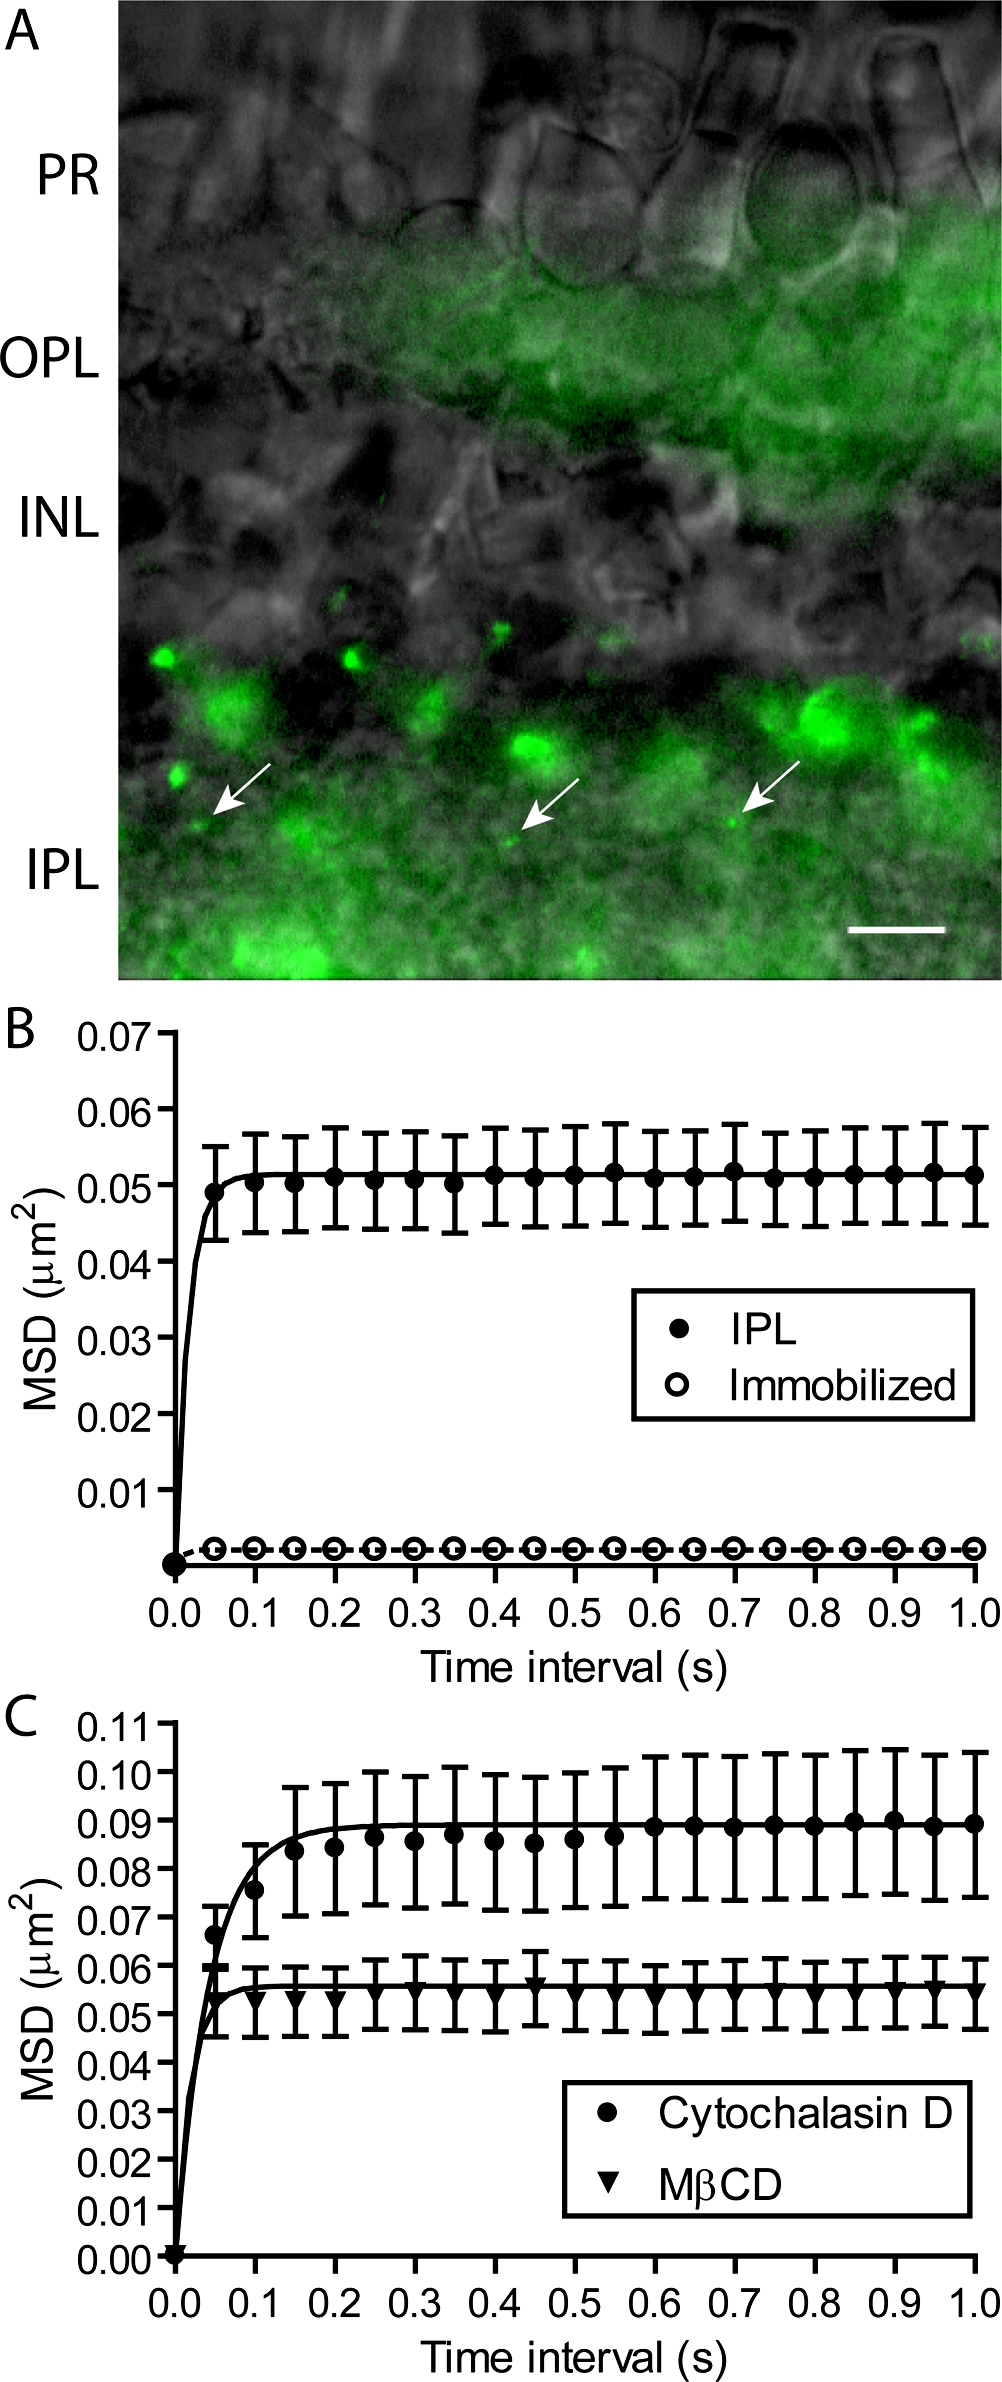
 Figure 4 of
Thoreson, Mol Vis 2013; 19:16-24.
Figure 4 of
Thoreson, Mol Vis 2013; 19:16-24.