Figure 3. Ca2+ channels move within confined domains on the terminals of isolated retinal bipolar cells. A: A plot of the trajectory of a single QD showing its position at 400 time points measured every 30 ms. B: A plot of mean squared displacement (MSD) versus time interval for individual Ca2+ channels in bipolar cell terminals (n=18). Confinement areas were calculated by fitting the data with Equation 3 (L=0.409±0.00479
μm). C: A diffusion coefficient of D=0.45±0.24 μm2/s (n=9) was determined from data acquired at 16 ms intervals using Equation 2. The straight line shows the fit to the MSD
versus time interval relationship from the origin through the first two time points.
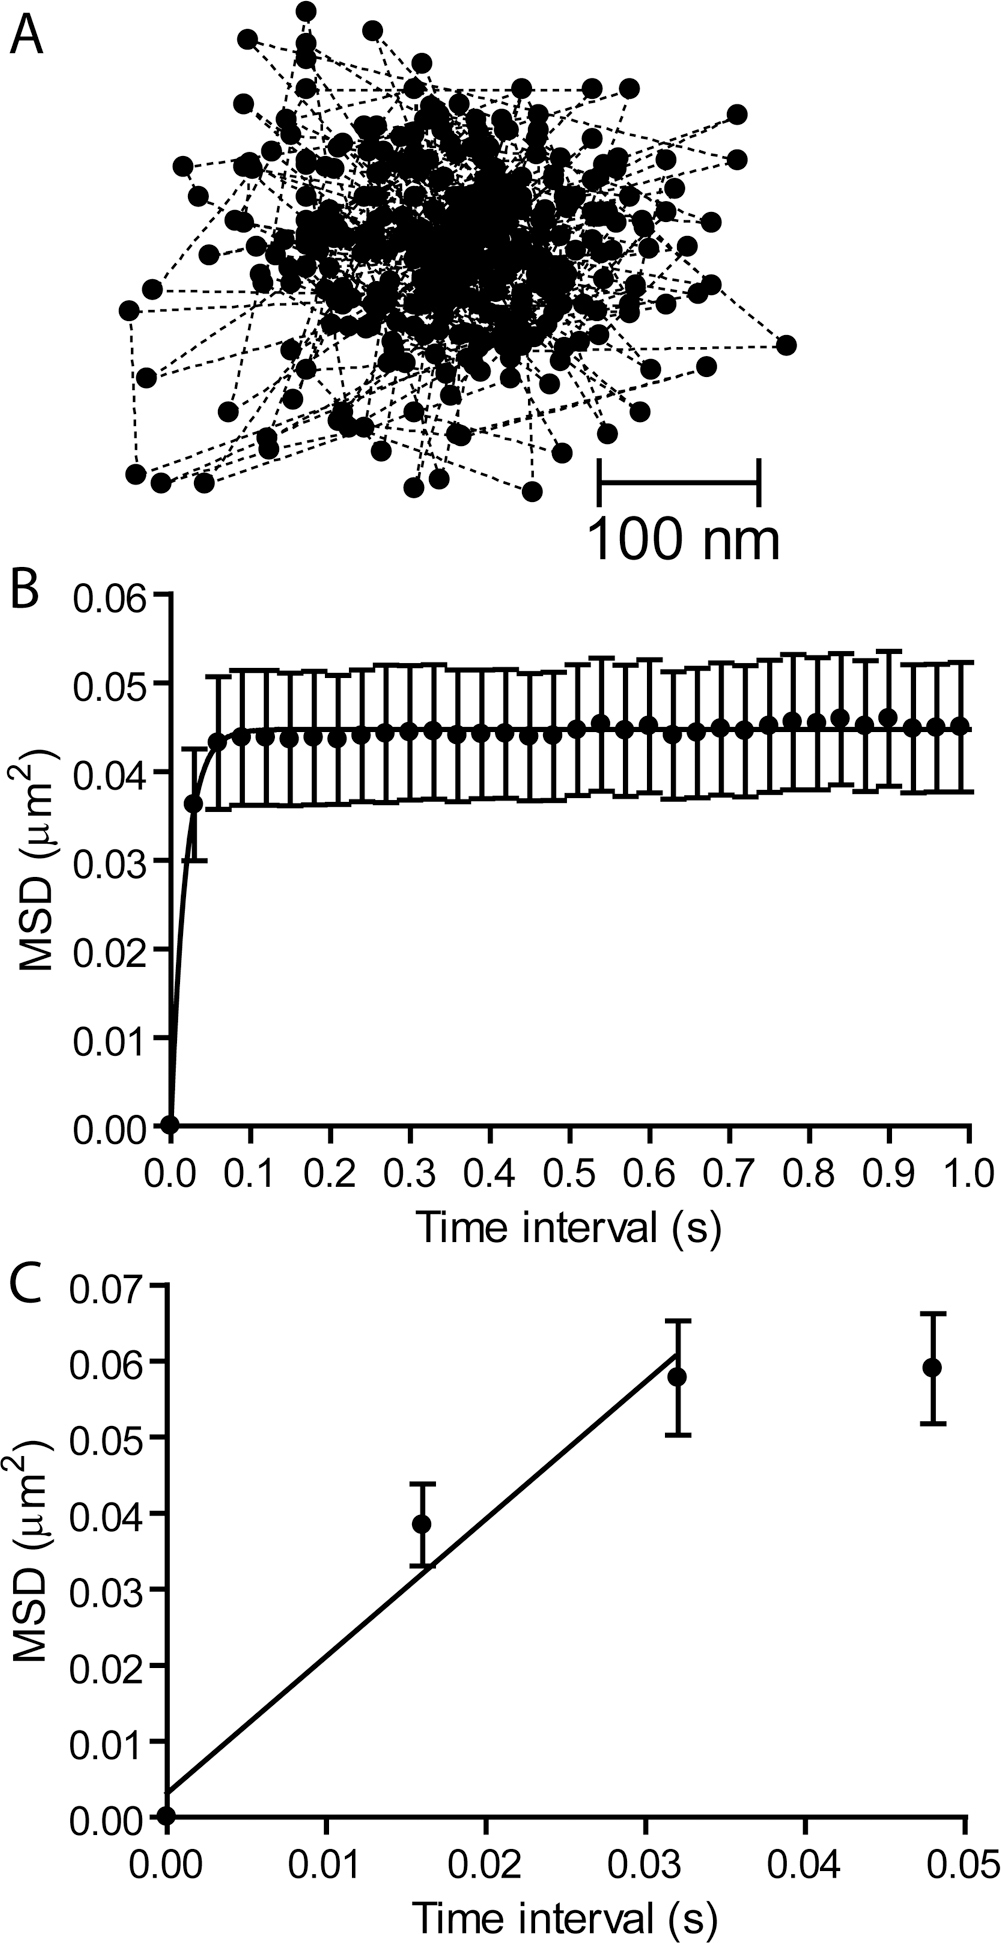
 Figure 3 of
Thoreson, Mol Vis 2013; 19:16-24.
Figure 3 of
Thoreson, Mol Vis 2013; 19:16-24.