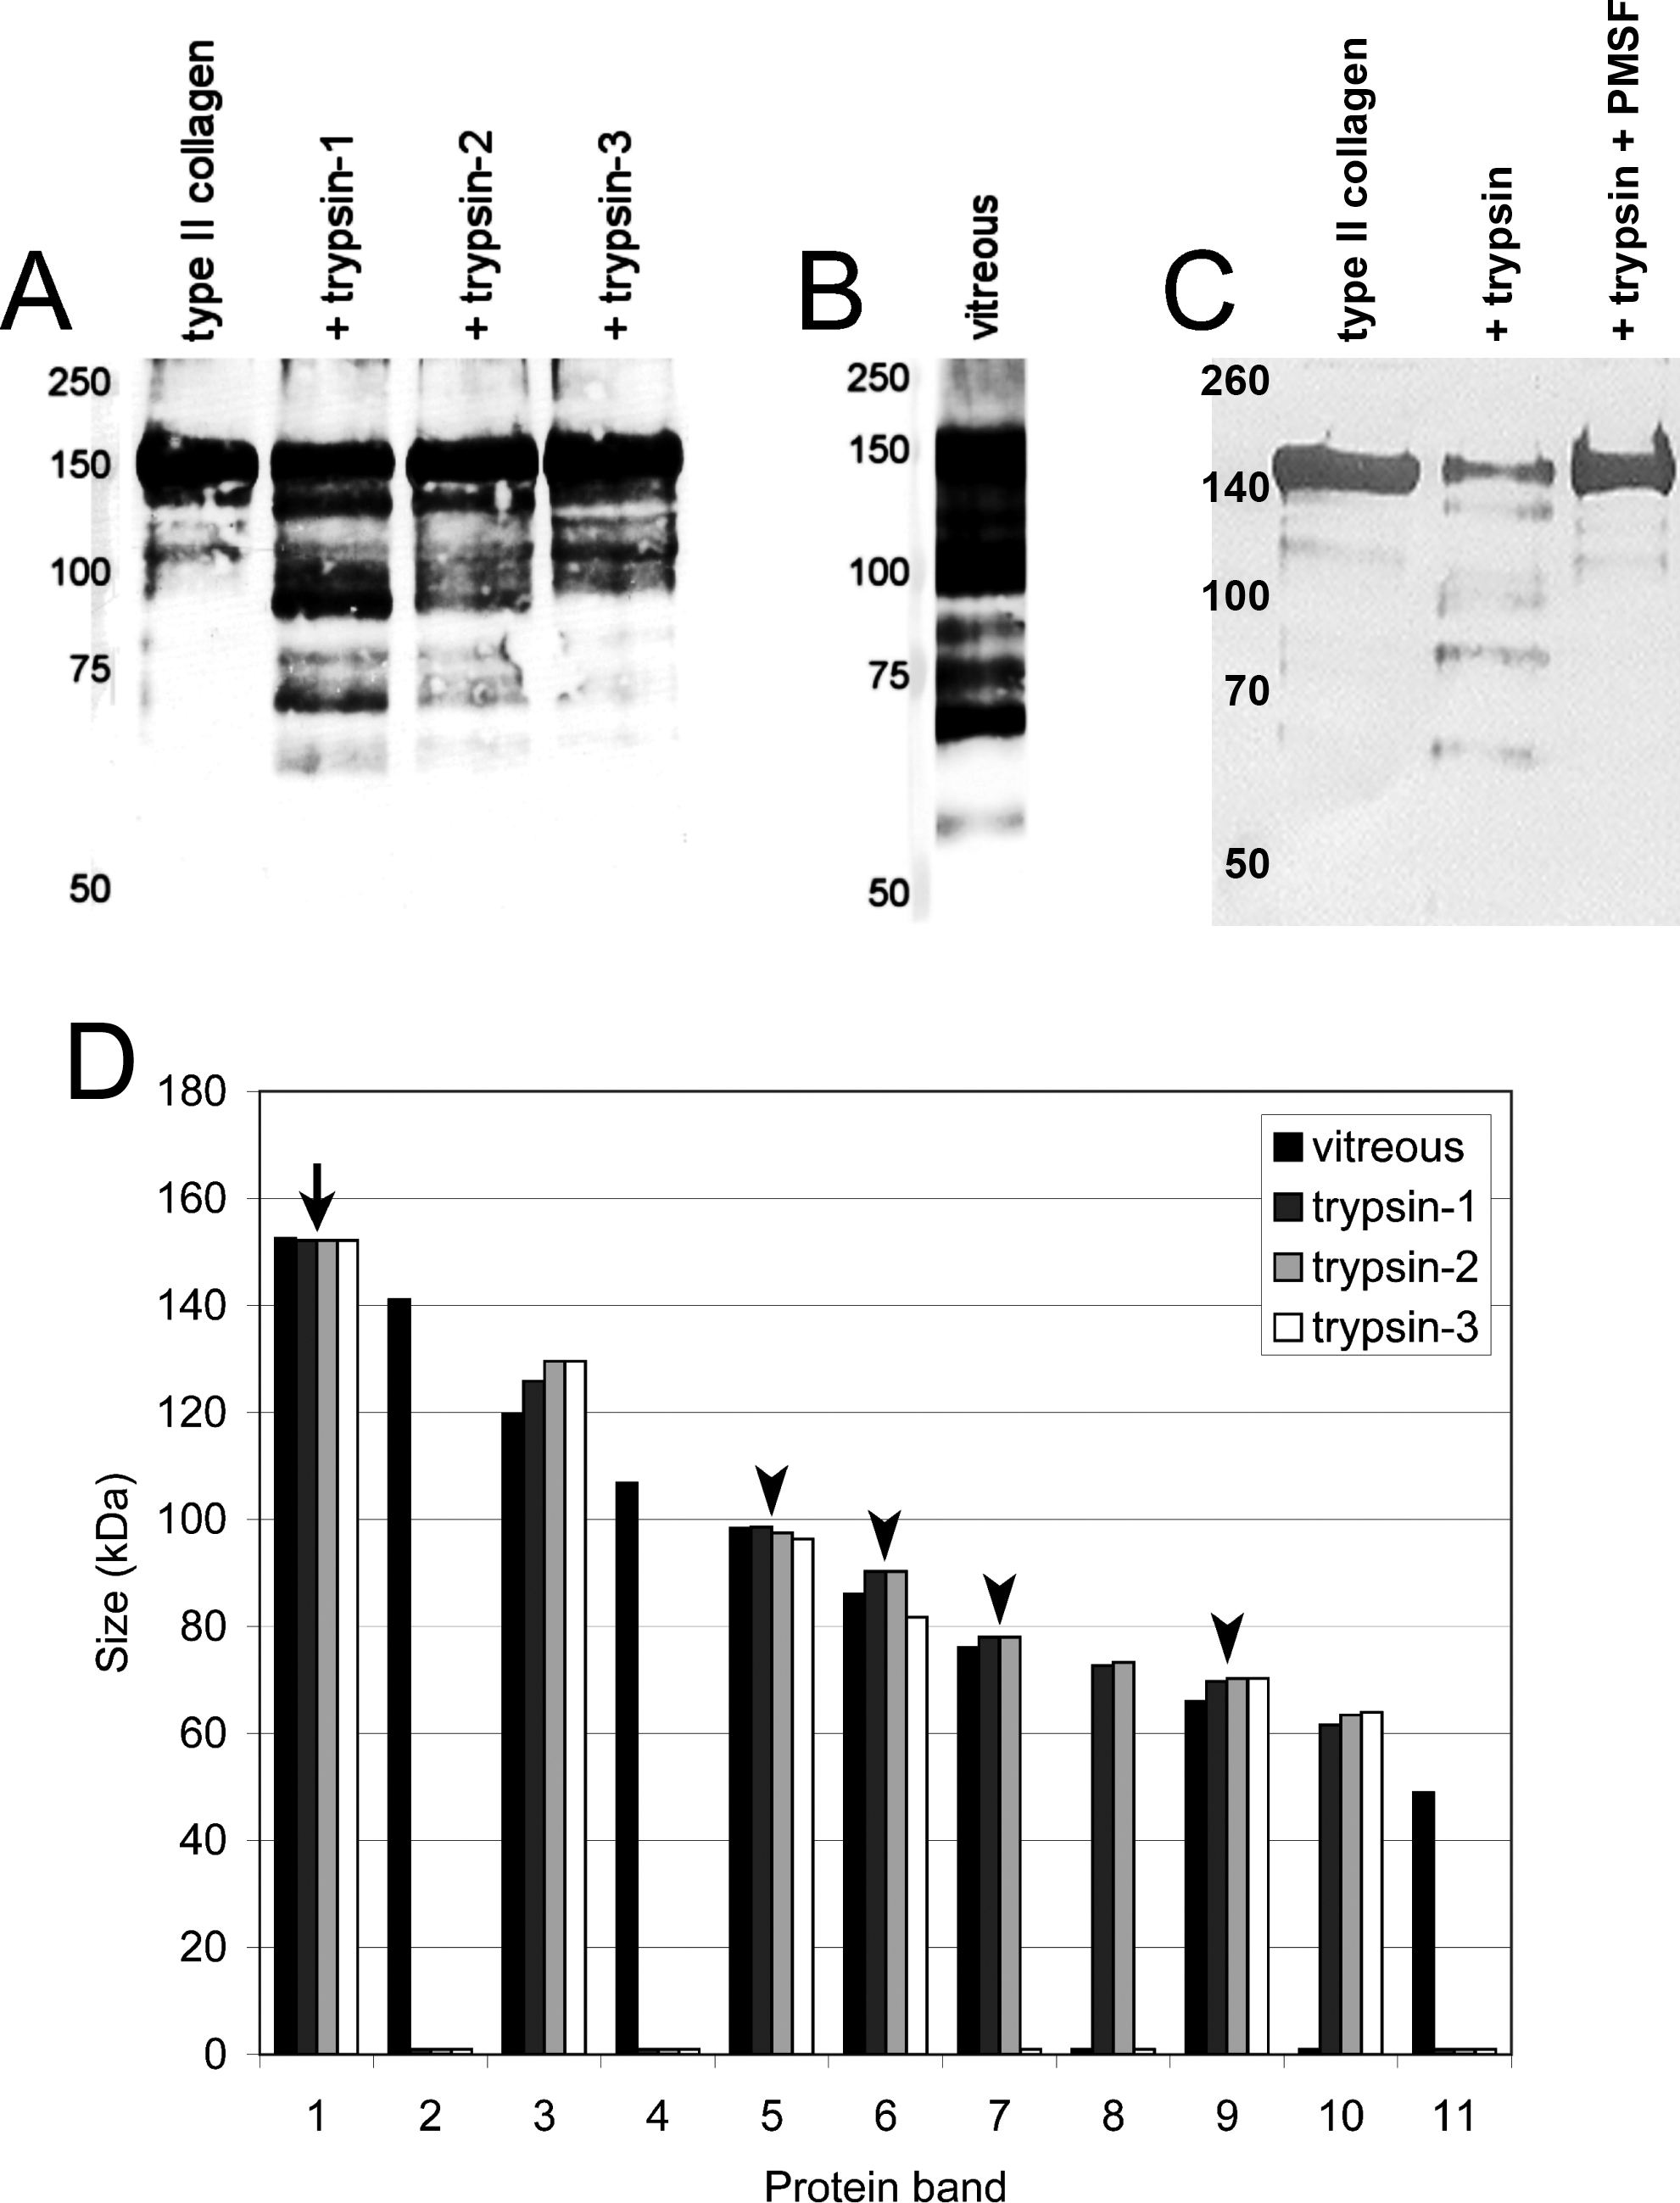
Figure 4. Type II collagen degradation by recombinant human trypsins. Panel
A shows uncleaved type II collagen from cartilage (left lane) and the degradation patterns after incubation with trypsin-1,
-2, and -3 (other lanes). Panel
B shows the type II collagen degradation pattern of the human vitreous [
19]. Inhibition of collagenolytic trypsin activity by phenylmethylsulfonyl fluoride (PMSF) is shown in panel
C. The left lanes of all western blots show the molecular weight marker. In panel
D, all bands found in panel
A and
B were numbered according to decreasing size and depicted in a bar chart. Protein band 1 (arrow) represents intact type II
collagen. Of protein bands 5, 6, 7, and 9 (arrowheads), the sizes of the in vitro formed type II collagen degradation products
are comparable with those found in the vitreous. Protein band 3 (asterisk) in the vitreous could be a trypsin degradation
product, although it does seem to be a bit small.
 Figure 4 of
van Deemter, Mol Vis 2013; 19:1591-1599.
Figure 4 of
van Deemter, Mol Vis 2013; 19:1591-1599.