Figure 6. Effect of diabetes on expression of SNCG, GFAP, and ADORA1. qRT-PCR analysis was performed on cDNA isolated from control and
STZ-induced diabetic rat retinas after 4 and 12 weeks. Expression of each gene was normalized to acidic ribosomal phosphoprotein
(P0) for each rat (A), and then scaled to the 4-week control rats for each gene (B; mean ± SEM). The 12-week diabetic rats had significantly lower SNCG and ADORA1 mRNA levels than the age-matched control
rats (**, p<0.01; ***, p<0.005). Diabetes did not affect the mRNA levels of GFAP at 4 or 12 weeks.
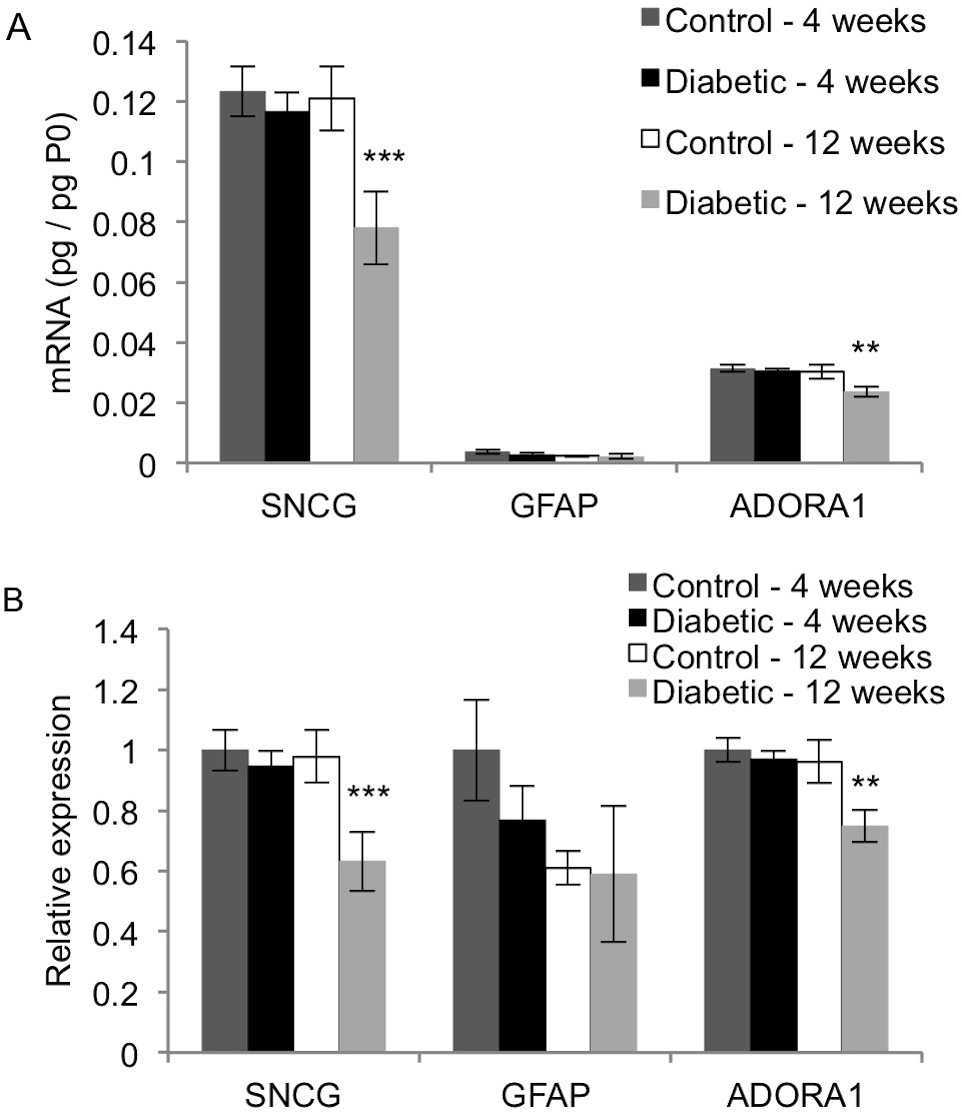
 Figure 6 of
Lau, Mol Vis 2013; 19:1538-1553.
Figure 6 of
Lau, Mol Vis 2013; 19:1538-1553.