Figure 3. Biochemical analysis of azithromycin treatment group versus control group. A: Interleukin-6 (IL-6) levels are expressed as ng/µg of total protein in conjunctival tissue. Azithromycin treatment reduced
IL-6 levels in conjunctival tissue. B: Measurement of nuclear factor-kappa B (NF-κB) expression in conjunctival tissue. Bars represent mean±SEM. β-actin was blotted
as an internal control. C: Real time polymerase chain reaction (RT–PCR) expression analysis of cyclooxygenase-2 (COX-2), IL-6, MMP-2, MMP-9, and TNF-α proinflammation genes in the azithromycin-treated group. Change is relative to the vehicle-treated group (reference). Data
are expressed as log2(RQ). D: Representative zymogram showing MMP-2 activity and the results shown as percentage of the azithromycin-treated group versus
the vehicle-treated group. Bars represent mean±SEM. A minimum of ten animals per group were included. All data were analyzed
with SPSS 15.0 software or DataAssist v2.0. (*p<0.05 versus vehicle).
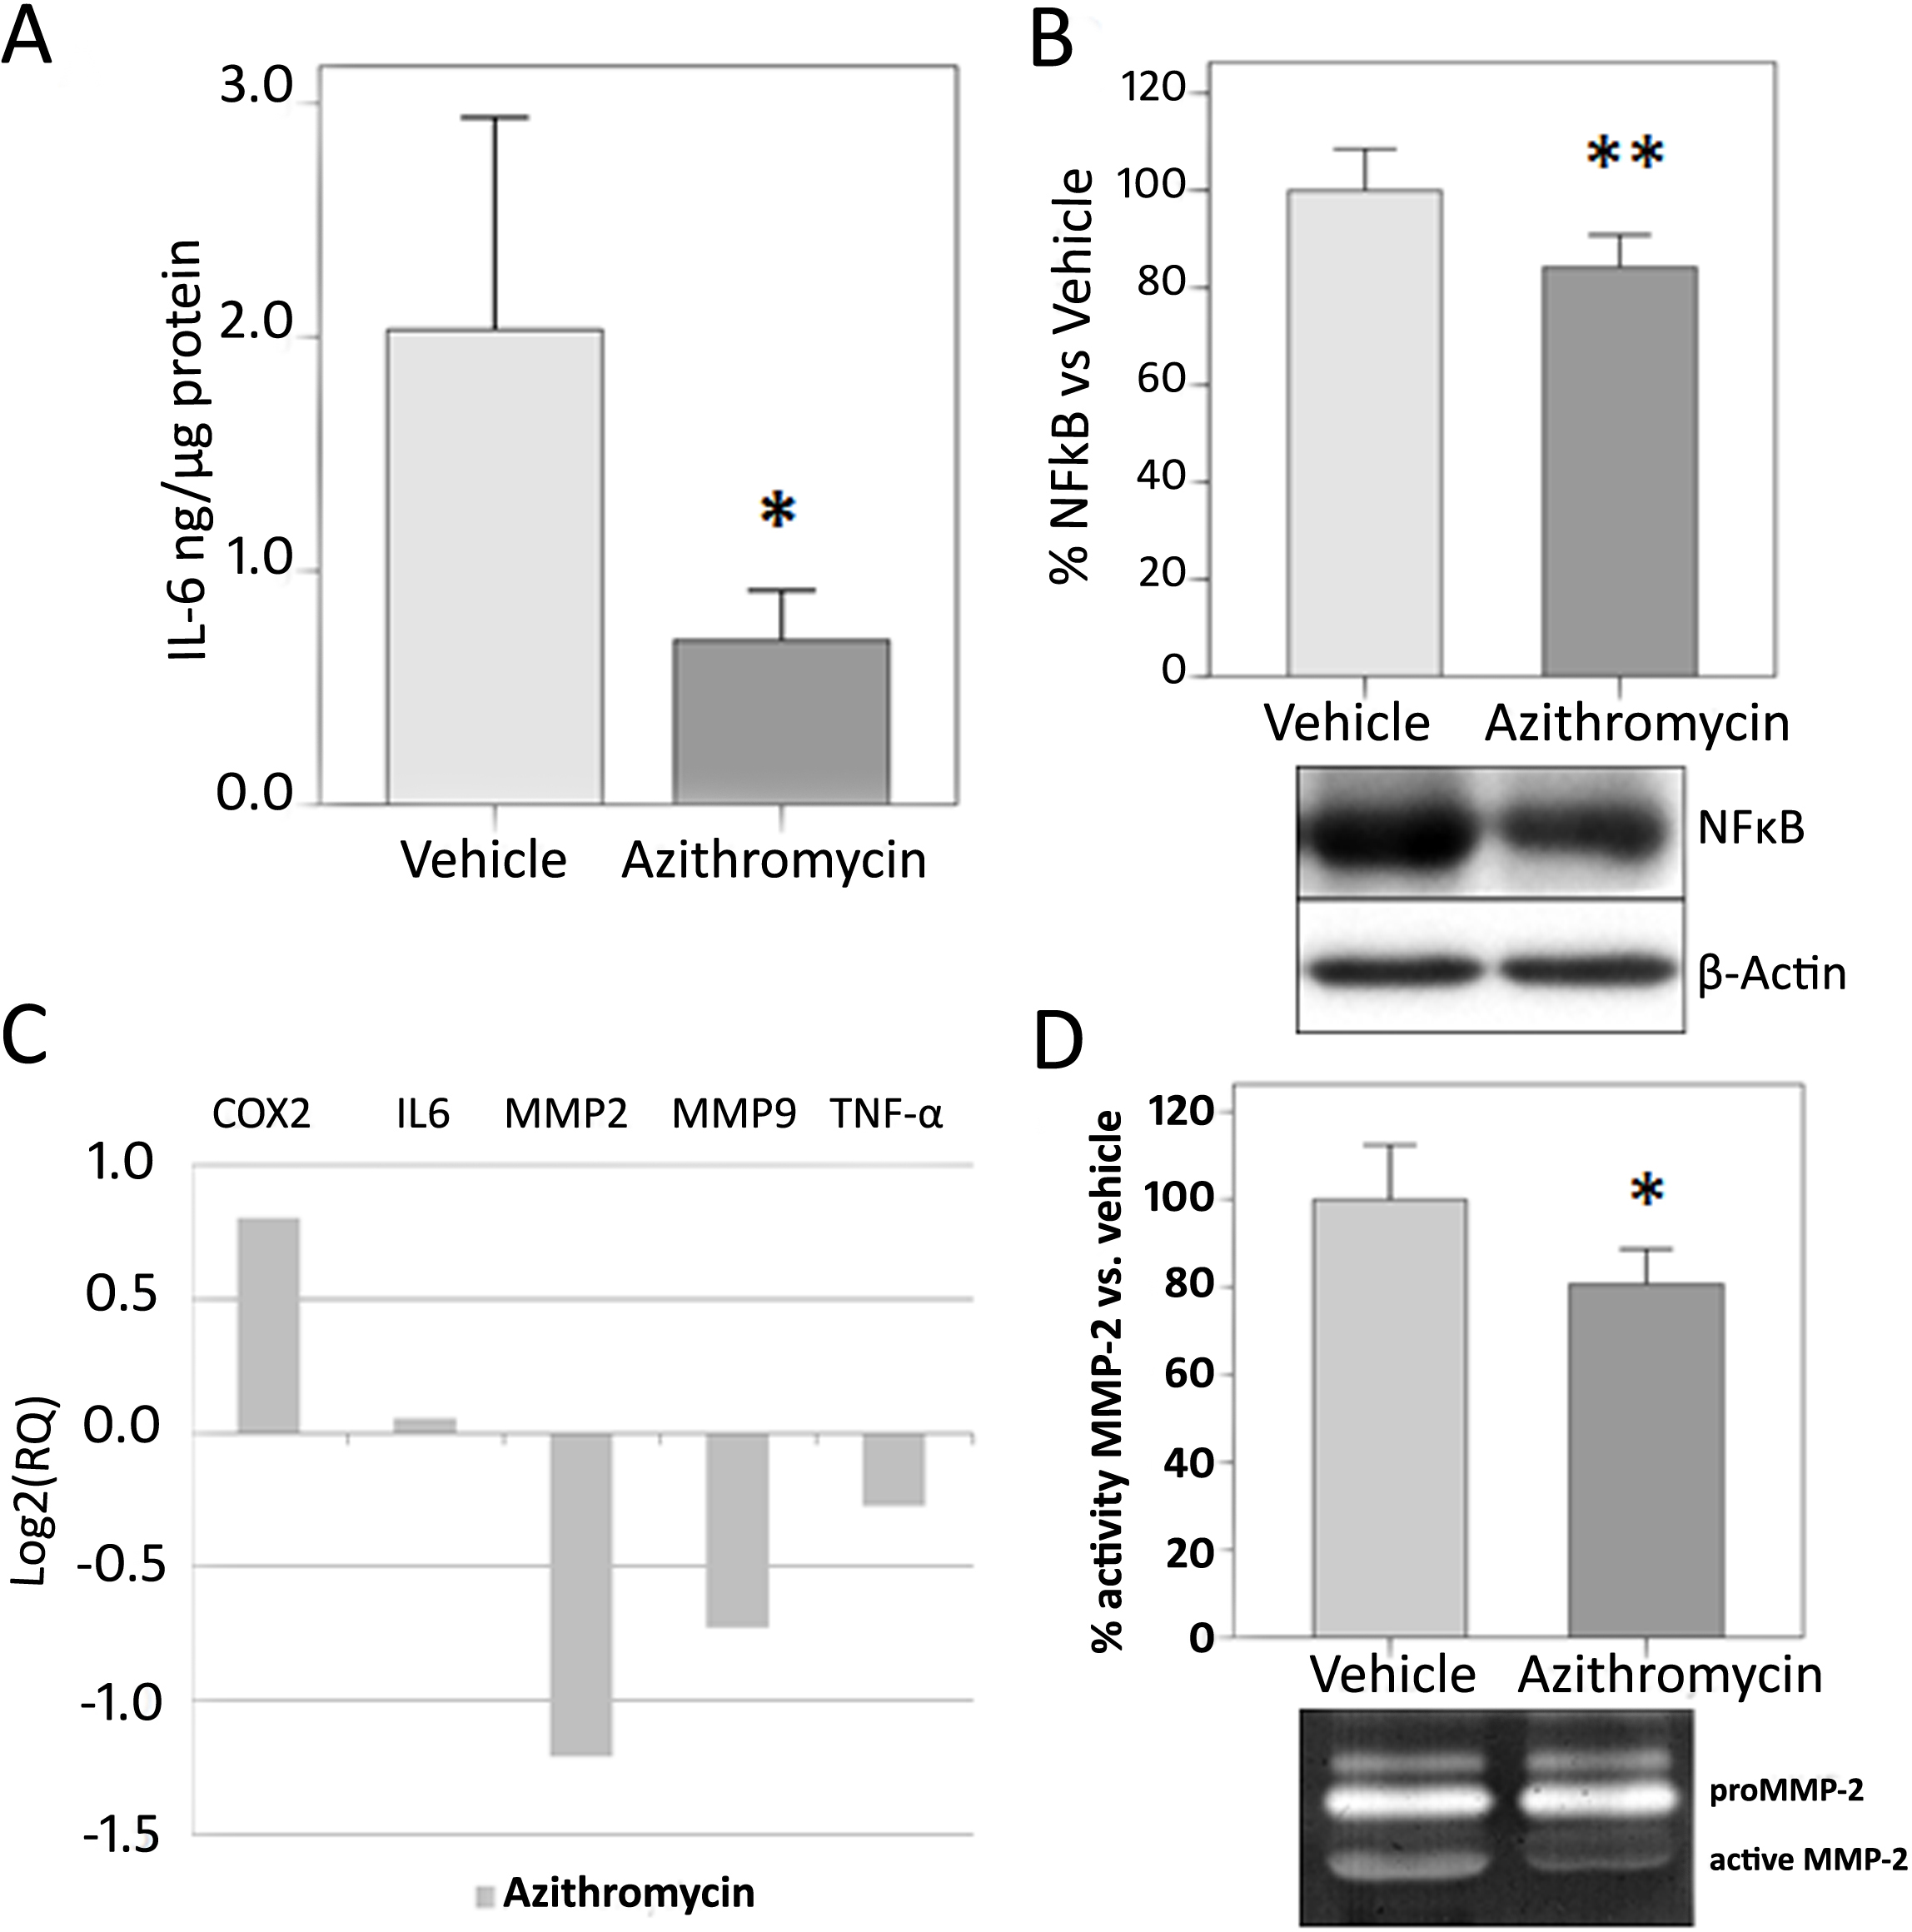
 Figure 3 of
Fernandez-Robredo, Mol Vis 2013; 19:153-165.
Figure 3 of
Fernandez-Robredo, Mol Vis 2013; 19:153-165.