Figure 1. Results obtained at the maximum time point for inflammation. A: Clinical signs score obtained by three blind independent observers. B and C: Interleukin-6 (IL-6) levels determined in conjunctival tissue, control versus LPS-treated group and control vs. time-course
lipopolysaccharide (LPS)-treated groups, respectively; data are expressed as mean±standard error of mean (SEM). D: Real time polymerase chain reaction (RT–PCR) expression analysis of cyclooxygenase-2 (COX-2), IL-6, MMP-2, MMP-9, and TNF-α proinflammation genes as a function of time in the LPS-treated group compared to the control group; data are expressed as
log2 (relative quantity [RQ]). All data were analyzed with SPSS 15.0 software or DataAssist v2.0. (*p<0.05; **p<0.01, and
***p<0.001 versus control)
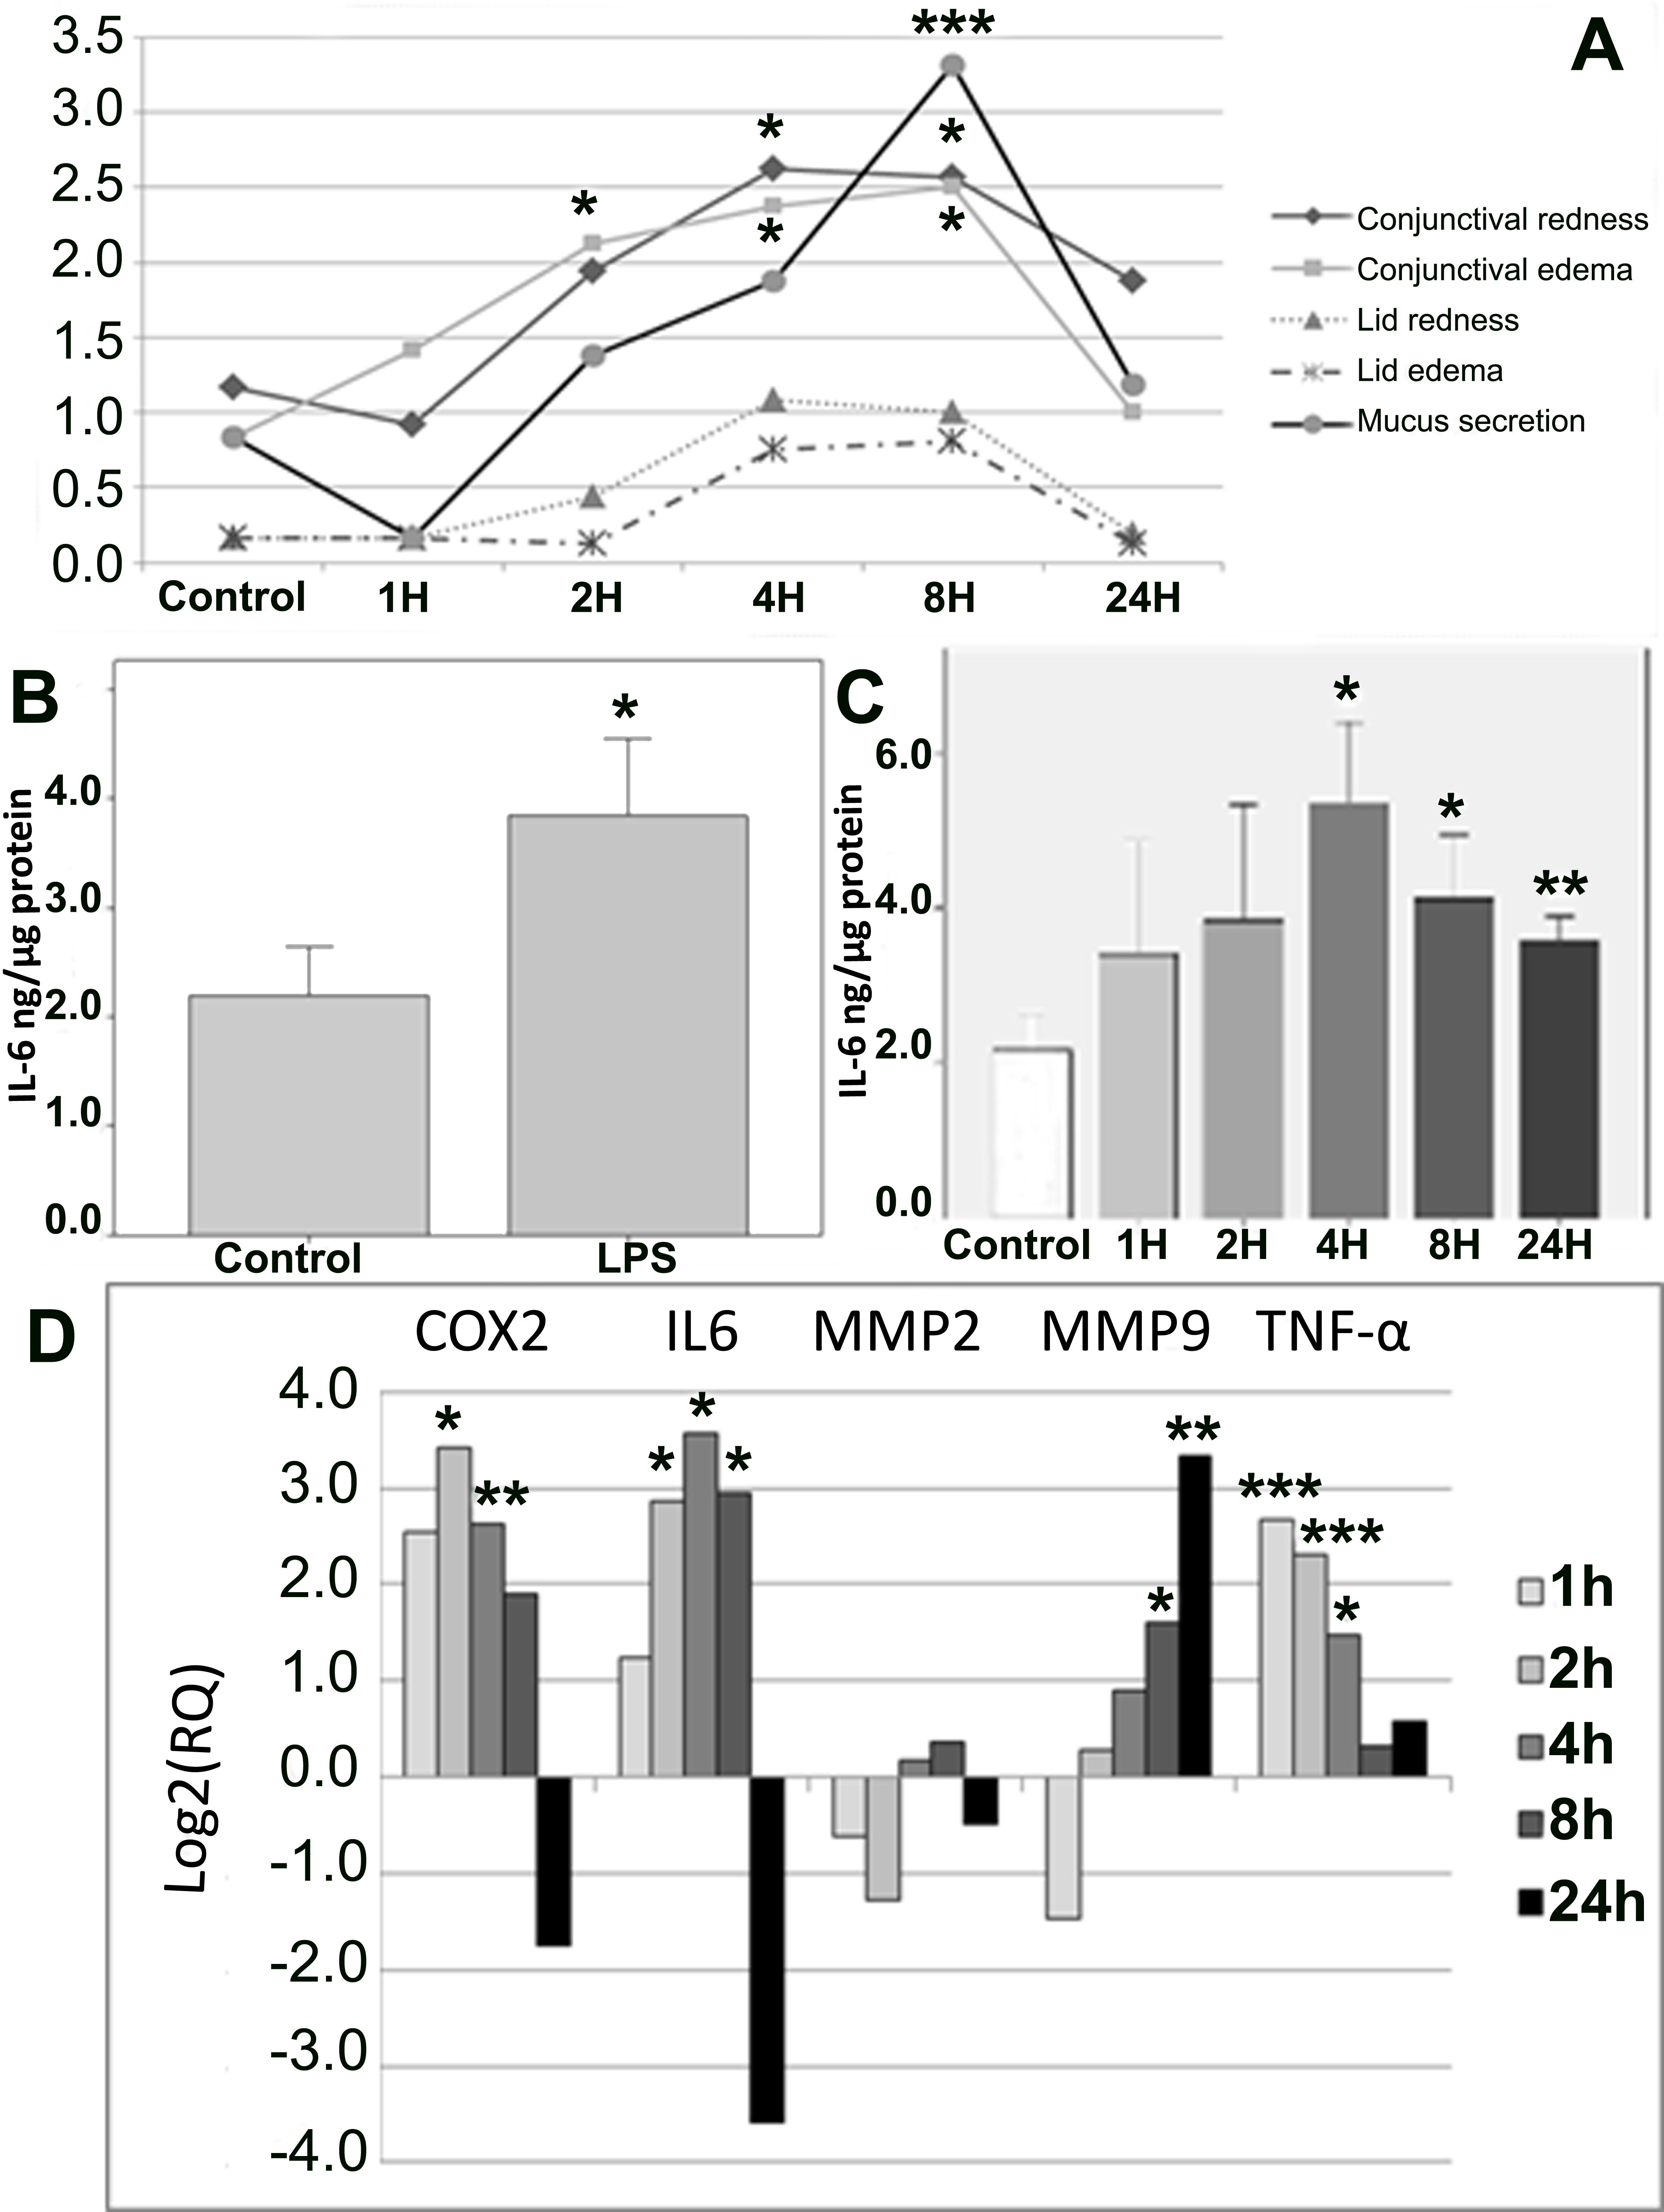
 Figure 1 of
Fernandez-Robredo, Mol Vis 2013; 19:153-165.
Figure 1 of
Fernandez-Robredo, Mol Vis 2013; 19:153-165.