Figure 6 of
Akhtar, Mol Vis 2013; 19:1526-1537.
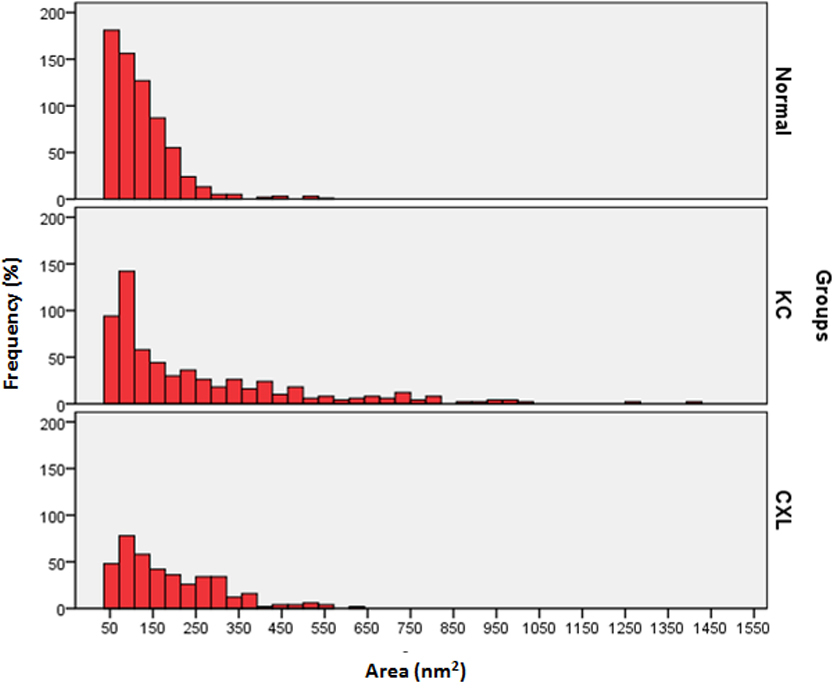
Figure 6.
Distribution of proteoglycan area (nm
2
) in normal, keratoconus, and cross-linked corneas. The data were derived from three corneas and six images of each group.
 Figure 6 of
Akhtar, Mol Vis 2013; 19:1526-1537.
Figure 6 of
Akhtar, Mol Vis 2013; 19:1526-1537.