Figure 5. Electron micrograph and digital images of proteoglycans (PG) of normal, keratoconus (KC), and cross-linked (CXL) corneas.
A: Electron micrograph of PGs which are present of normal corneas. B: Digital image is obtained after processing image shown in A, showing variable area distribution of PGs. C: Electron micrograph which are present in PGs of KC corneas. D: Digital image is obtained after processing image shown in C, showing variable area distribution of PGs. E: Electron micrograph of PGs of CXL corneas. F: Digital image obtained after processing image shown in E, showing variable area distribution of PGs. PG=Proteoglycan Proteoglycans color coding: Red=50–350 nm2, Green=350–650 nm2, Blue=650–950 nm2, Yellow=950–1250 nm2, Aqua=1250–1550 nm2, Pink=1550–1850 nm2, Brown=1850–2150 nm2.
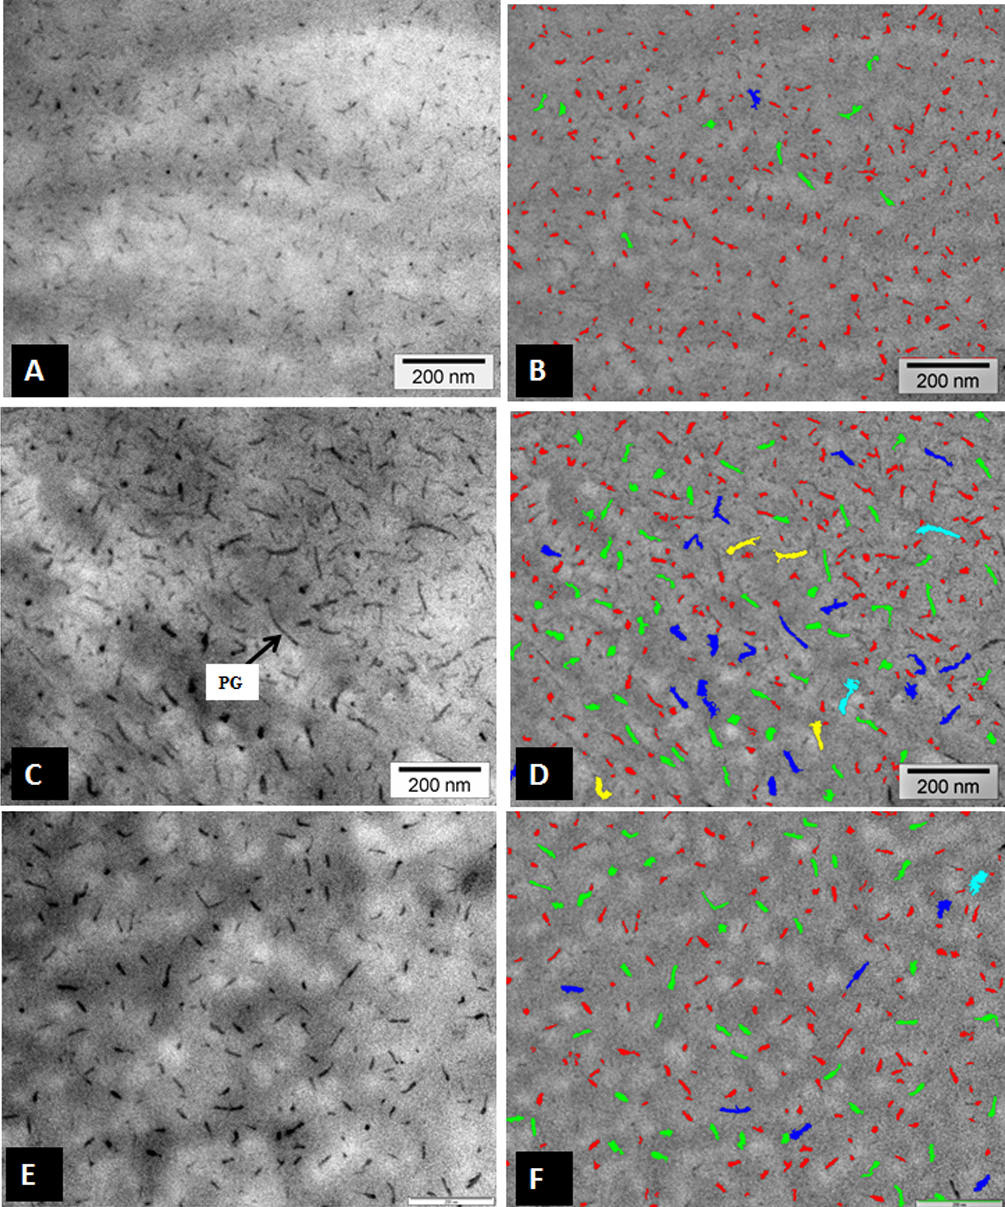
 Figure 5 of
Akhtar, Mol Vis 2013; 19:1526-1537.
Figure 5 of
Akhtar, Mol Vis 2013; 19:1526-1537.