Figure 3. Box plots. Box plots display the median and quartiles (Q0,25 and Q0,75) and the total range of the ocular surface disease index score, which was 8.3 in the control group (n=19) and 52.2 in the
patient group (n= 27; p<0.001, Wilcoxon non parametric testing), showing that the patient group had significantly more complaints
from ocular surface disease than the control group.
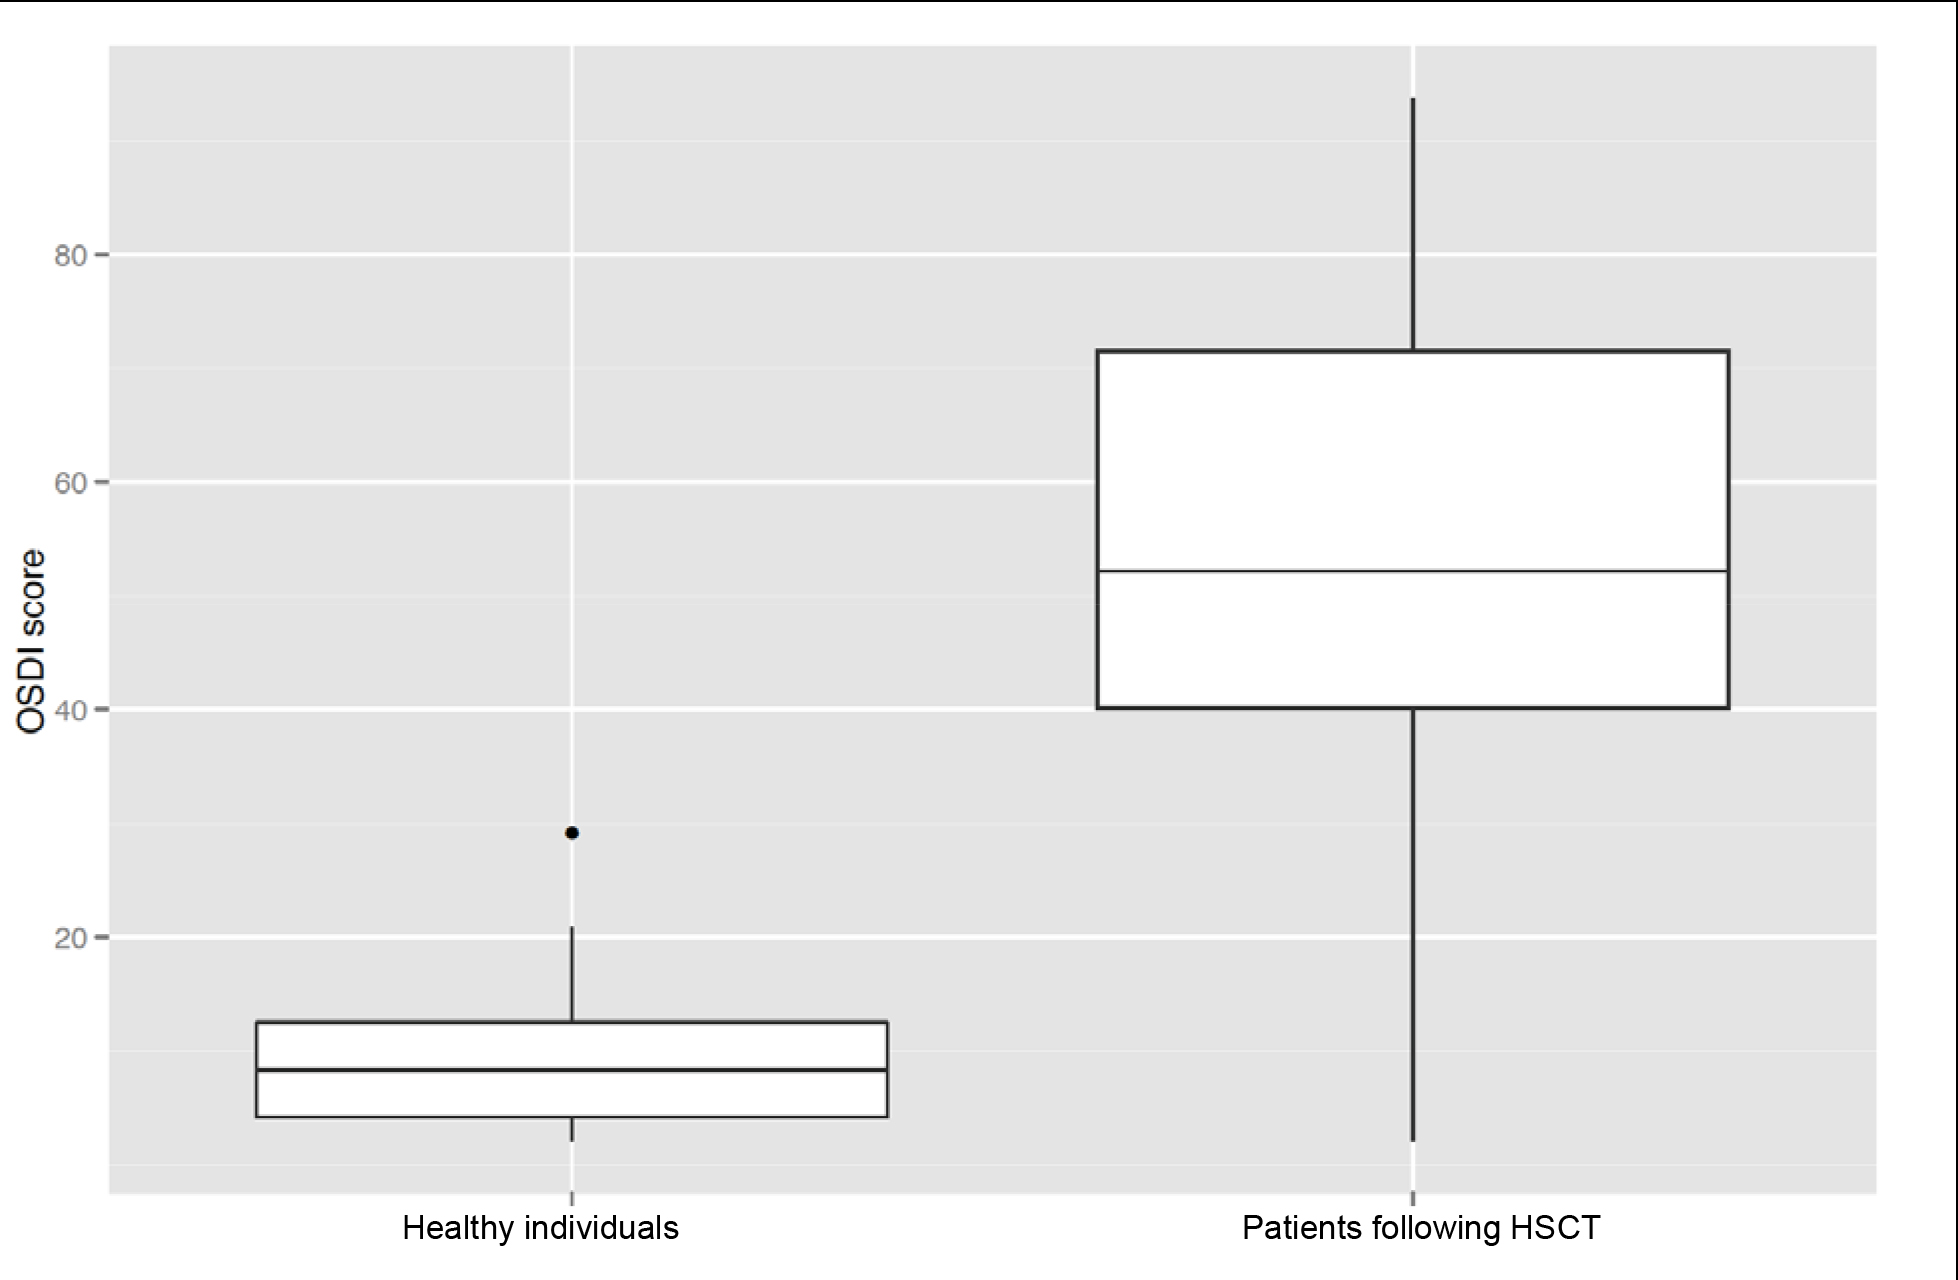
 Figure 3 of
Eberwein, Mol Vis 2013; 19:1492-1501.
Figure 3 of
Eberwein, Mol Vis 2013; 19:1492-1501.