Figure 2. Oxford grades were compared between the control (n=19) and the patient group (n=27). Box plots display the median and quartiles
(Q0,25 and Q0,75) and the total range. Median grade was 0 in the control group and 3 in the patient group, which was statistically significant
(p<0.001, Wilcoxon non-parametric testing), showing that the patient group depicted significantly more ocular surface staining
than the control group.
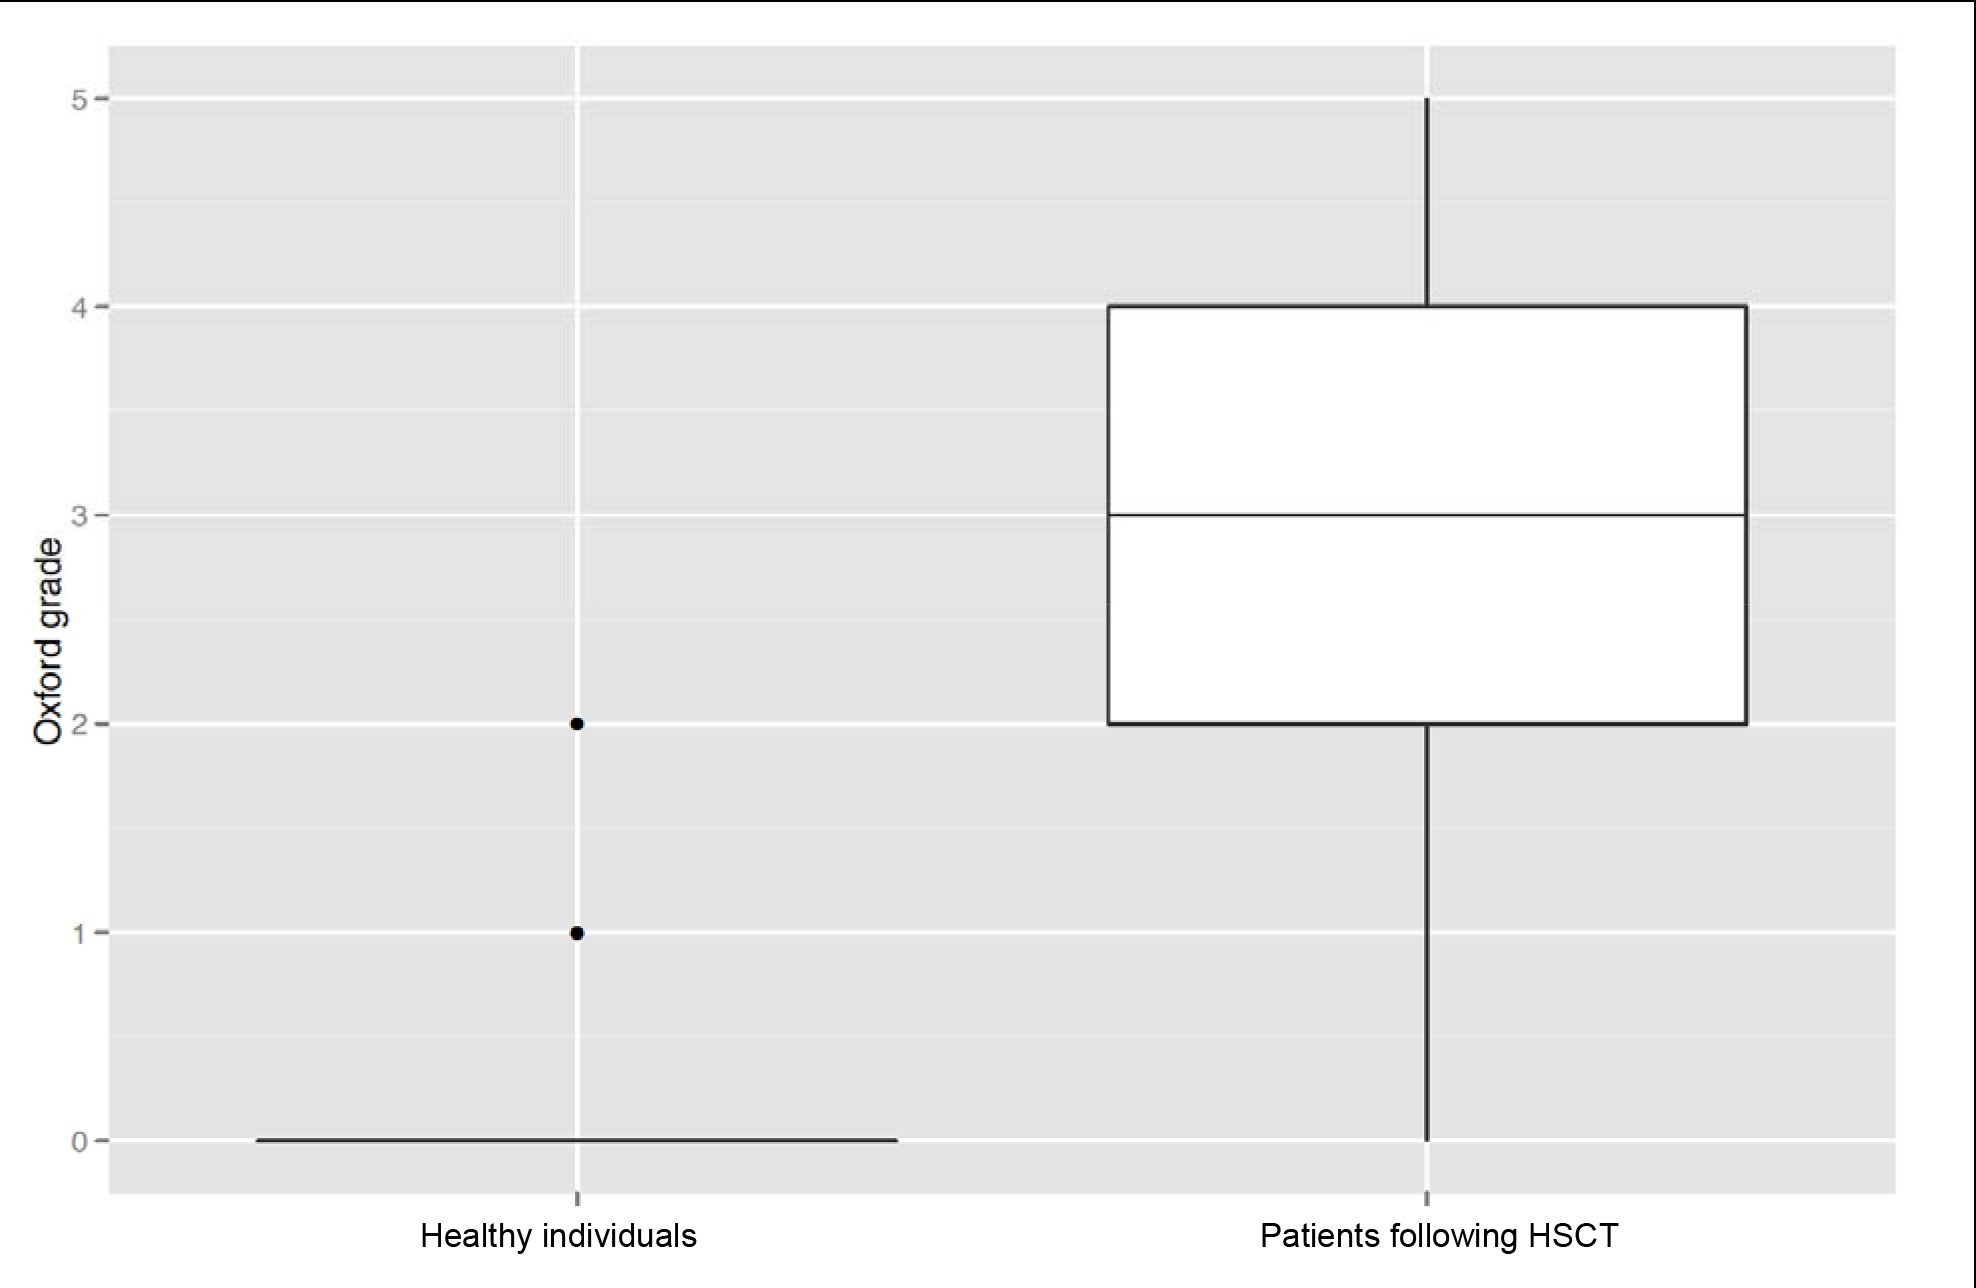
 Figure 2 of
Eberwein, Mol Vis 2013; 19:1492-1501.
Figure 2 of
Eberwein, Mol Vis 2013; 19:1492-1501.