Figure 7. Comparison of central and peripheral retinal ganglion cells (RGCs) viability. Fluorescent photomicrographs of β-III tubulin+ surviving RGCs are shown on the central (A) and peripheral (B) retinas in intact retinas. C: Data from various experimental conditions are presented as the ratio of the number of survival RGCs in the peripheral region
of the retina to that in central region. Error bars=standard deviations (SDs). Scale bar=50 μm, sample size : n=7, 8, 10,
7 from left to right.
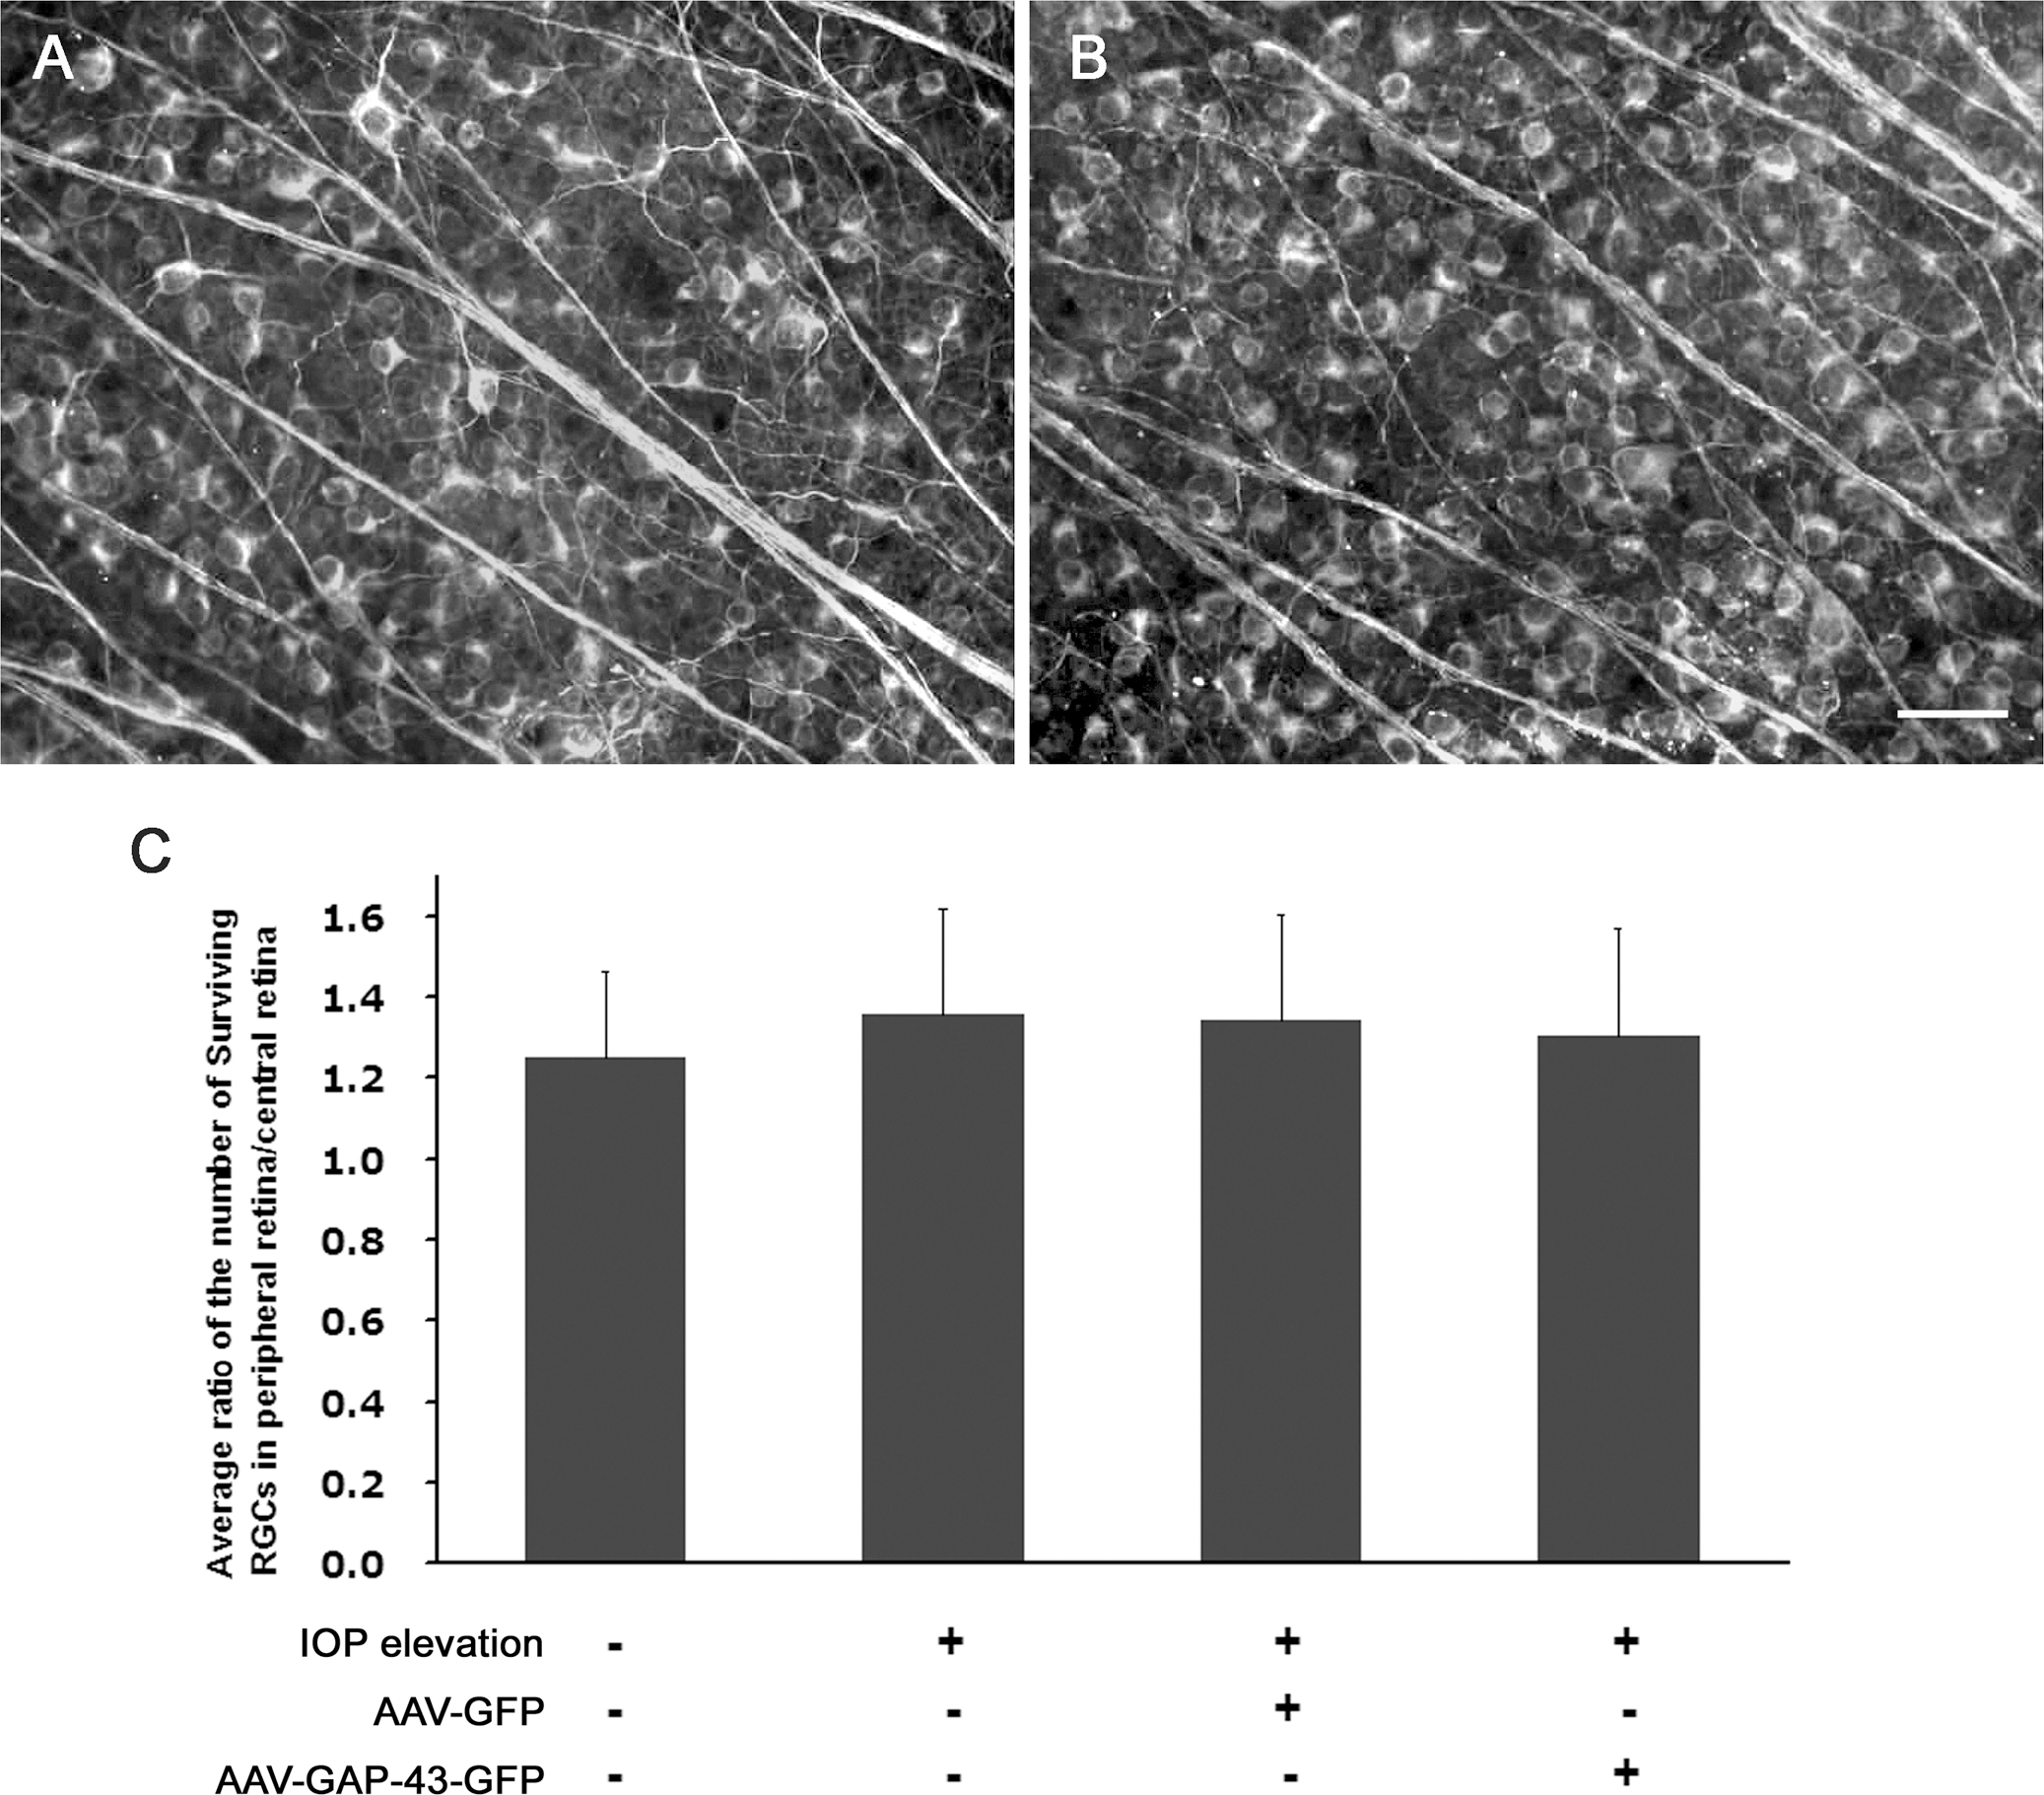
 Figure 7 of
Huang, Mol Vis 2013; 19:1422-1432.
Figure 7 of
Huang, Mol Vis 2013; 19:1422-1432.