Figure 6. Average numbers of β-III tubulin+ surviving retinal ganglion cells (RGCs) under various experimental conditions 3 weeks after
laser-induced IOP elevation. Statistical analysis was conducted against the control groups marked. **p<0.01 and ***p<0.001,
Bonferroni test. Error bars=standard deviations (SDs), sample size : n=7, 6, 8, 10, 7 from left to right.
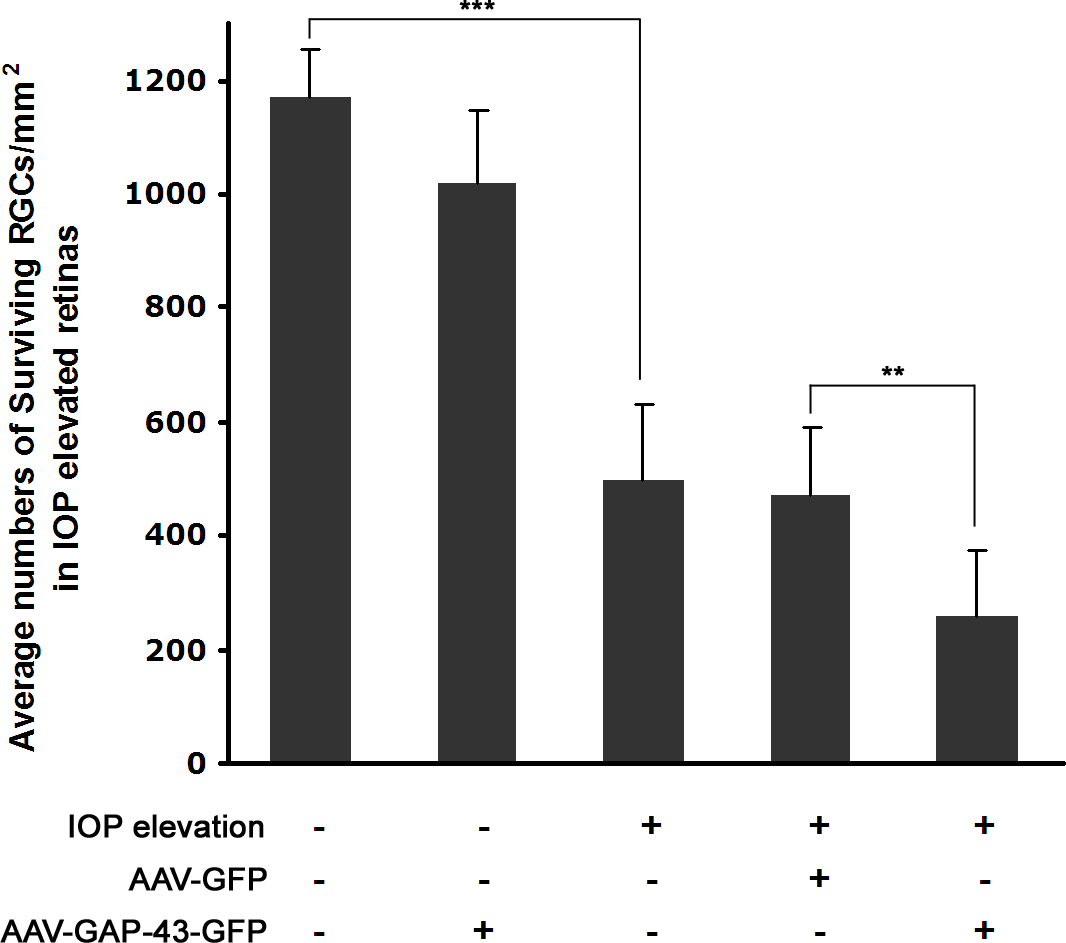
 Figure 6 of
Huang, Mol Vis 2013; 19:1422-1432.
Figure 6 of
Huang, Mol Vis 2013; 19:1422-1432.