Figure 3. Fluorescent confocal micrographs showing characteristics of green fluorescent protein (GFP)+ transfected cells (in green) and syntaxin+ cells (in red) in a retinal slice. Most GFP+ transfected cells were located in the GCL. Meanwhile, a few transfected cells were also seen in the INL (A, yellow arrow). The field in white box (A) was scanned at different layers with high resolution confocal microscopy (B, C, D, and E). The white thin cross in each figure indicates the same position (Z axis) of scanning. The arrowhead shows the syntaxin+ amacrine cell (red) was transfected by the viral vector (green, GFP+). White arrows show the GFP+ transfected cells without syntaxin staining. Scale bar=25 μm. GCL, ganglion cell layer; IPL, inner plexiform layer; INL,
inner nuclear layer; OPL, outer plexiform layer; ONL, outer nuclear layer.
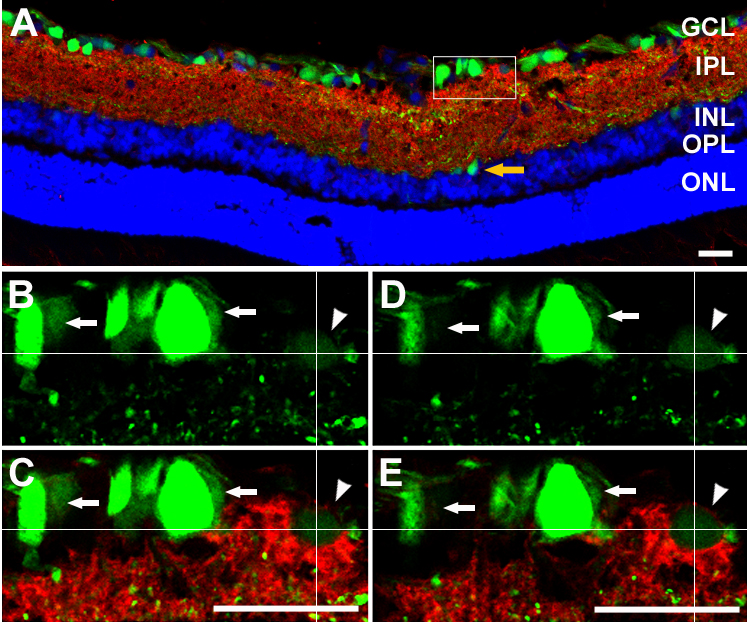
 Figure 3 of
Huang, Mol Vis 2013; 19:1422-1432.
Figure 3 of
Huang, Mol Vis 2013; 19:1422-1432.