Figure 3. Diabetic and nondiabetic mouse optic nerves. A, B, and C show electron micrographs of diabetic and nondiabetic mouse optic nerves. No differences in axon density were observed between
groups. Experimental groups referred to in this figure are: A; Nondiabetic (N), B; Diabetic-STZ (D STZ), and C; Diabetic-Ins2Akita (D Ins2Akita). Scale bar=10 µm.
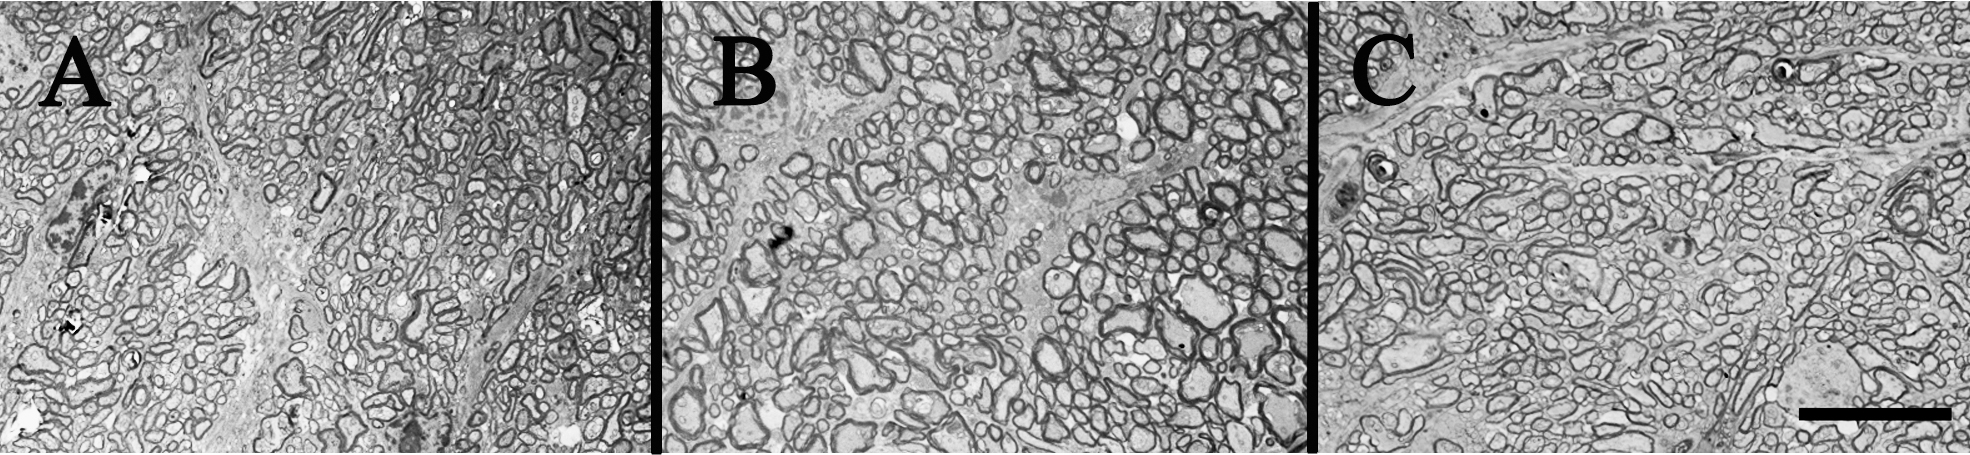
 Figure 3 of
Howell, Mol Vis 2013; 19:1413-1421.
Figure 3 of
Howell, Mol Vis 2013; 19:1413-1421.