Figure 1. Emission spectrum analysis of mitochondrial depolarization in HLE-B3 cells treated with SB216763. HLE-B3 cells were incubated
for 90 min with serum-free minimal essential medium (MEM) containing SB216763 (12 µM) or 0.05% DMSO vehicle. After the incubation
period, the cells were switched to hypoxia for 3 h. At the end of the hypoxic exposure the oxygen depleted media was removed
and fresh, oxygenated serum-free MEM containing 5µg/ml JC-1, a depolarization sensitive dye, with either SB216763 or DMSO
was added for 30 min in atmospheric oxygen. At the end of the 30 min period, the culture media was again removed and fresh
serum-free MEM containing SB216763 or DMSO added. A random field of cells was scanned every 150 sec for 75 min. A: The emission spectra for HLE-B3 cells treated with 12 µM SB216763 was analyzed. B: The analysis of the serial emission spectrum for HLE-B3 cells treated with 0.05% DMSO in the presence of the potentiometric
dye (JC-1). C: The analysis of the serial emission spectrum of HLE-B3 cells treated with 12 µM SB216763 and JC-1. D: The analysis of the emission spectra from the SB216763 treated cells (refer to C) after deconvolution was used to suppress the contribution from the inhibitor (refer to A). Emission spectrum analysis occurred every 150 sec over 75 min but only the data points for every 15 min interval is shown.
E: The graph of green emission (540 nm) over red emission (595 nm) of SB216763 treated cells with JC-1 after deconvolution
(red dots) versus DMSO with JC-1control cells (black dots). The experiment was performed on three independent populations
of lens epithelial cells. The data is not a composite of the three runs but rather the best of the three is shown.
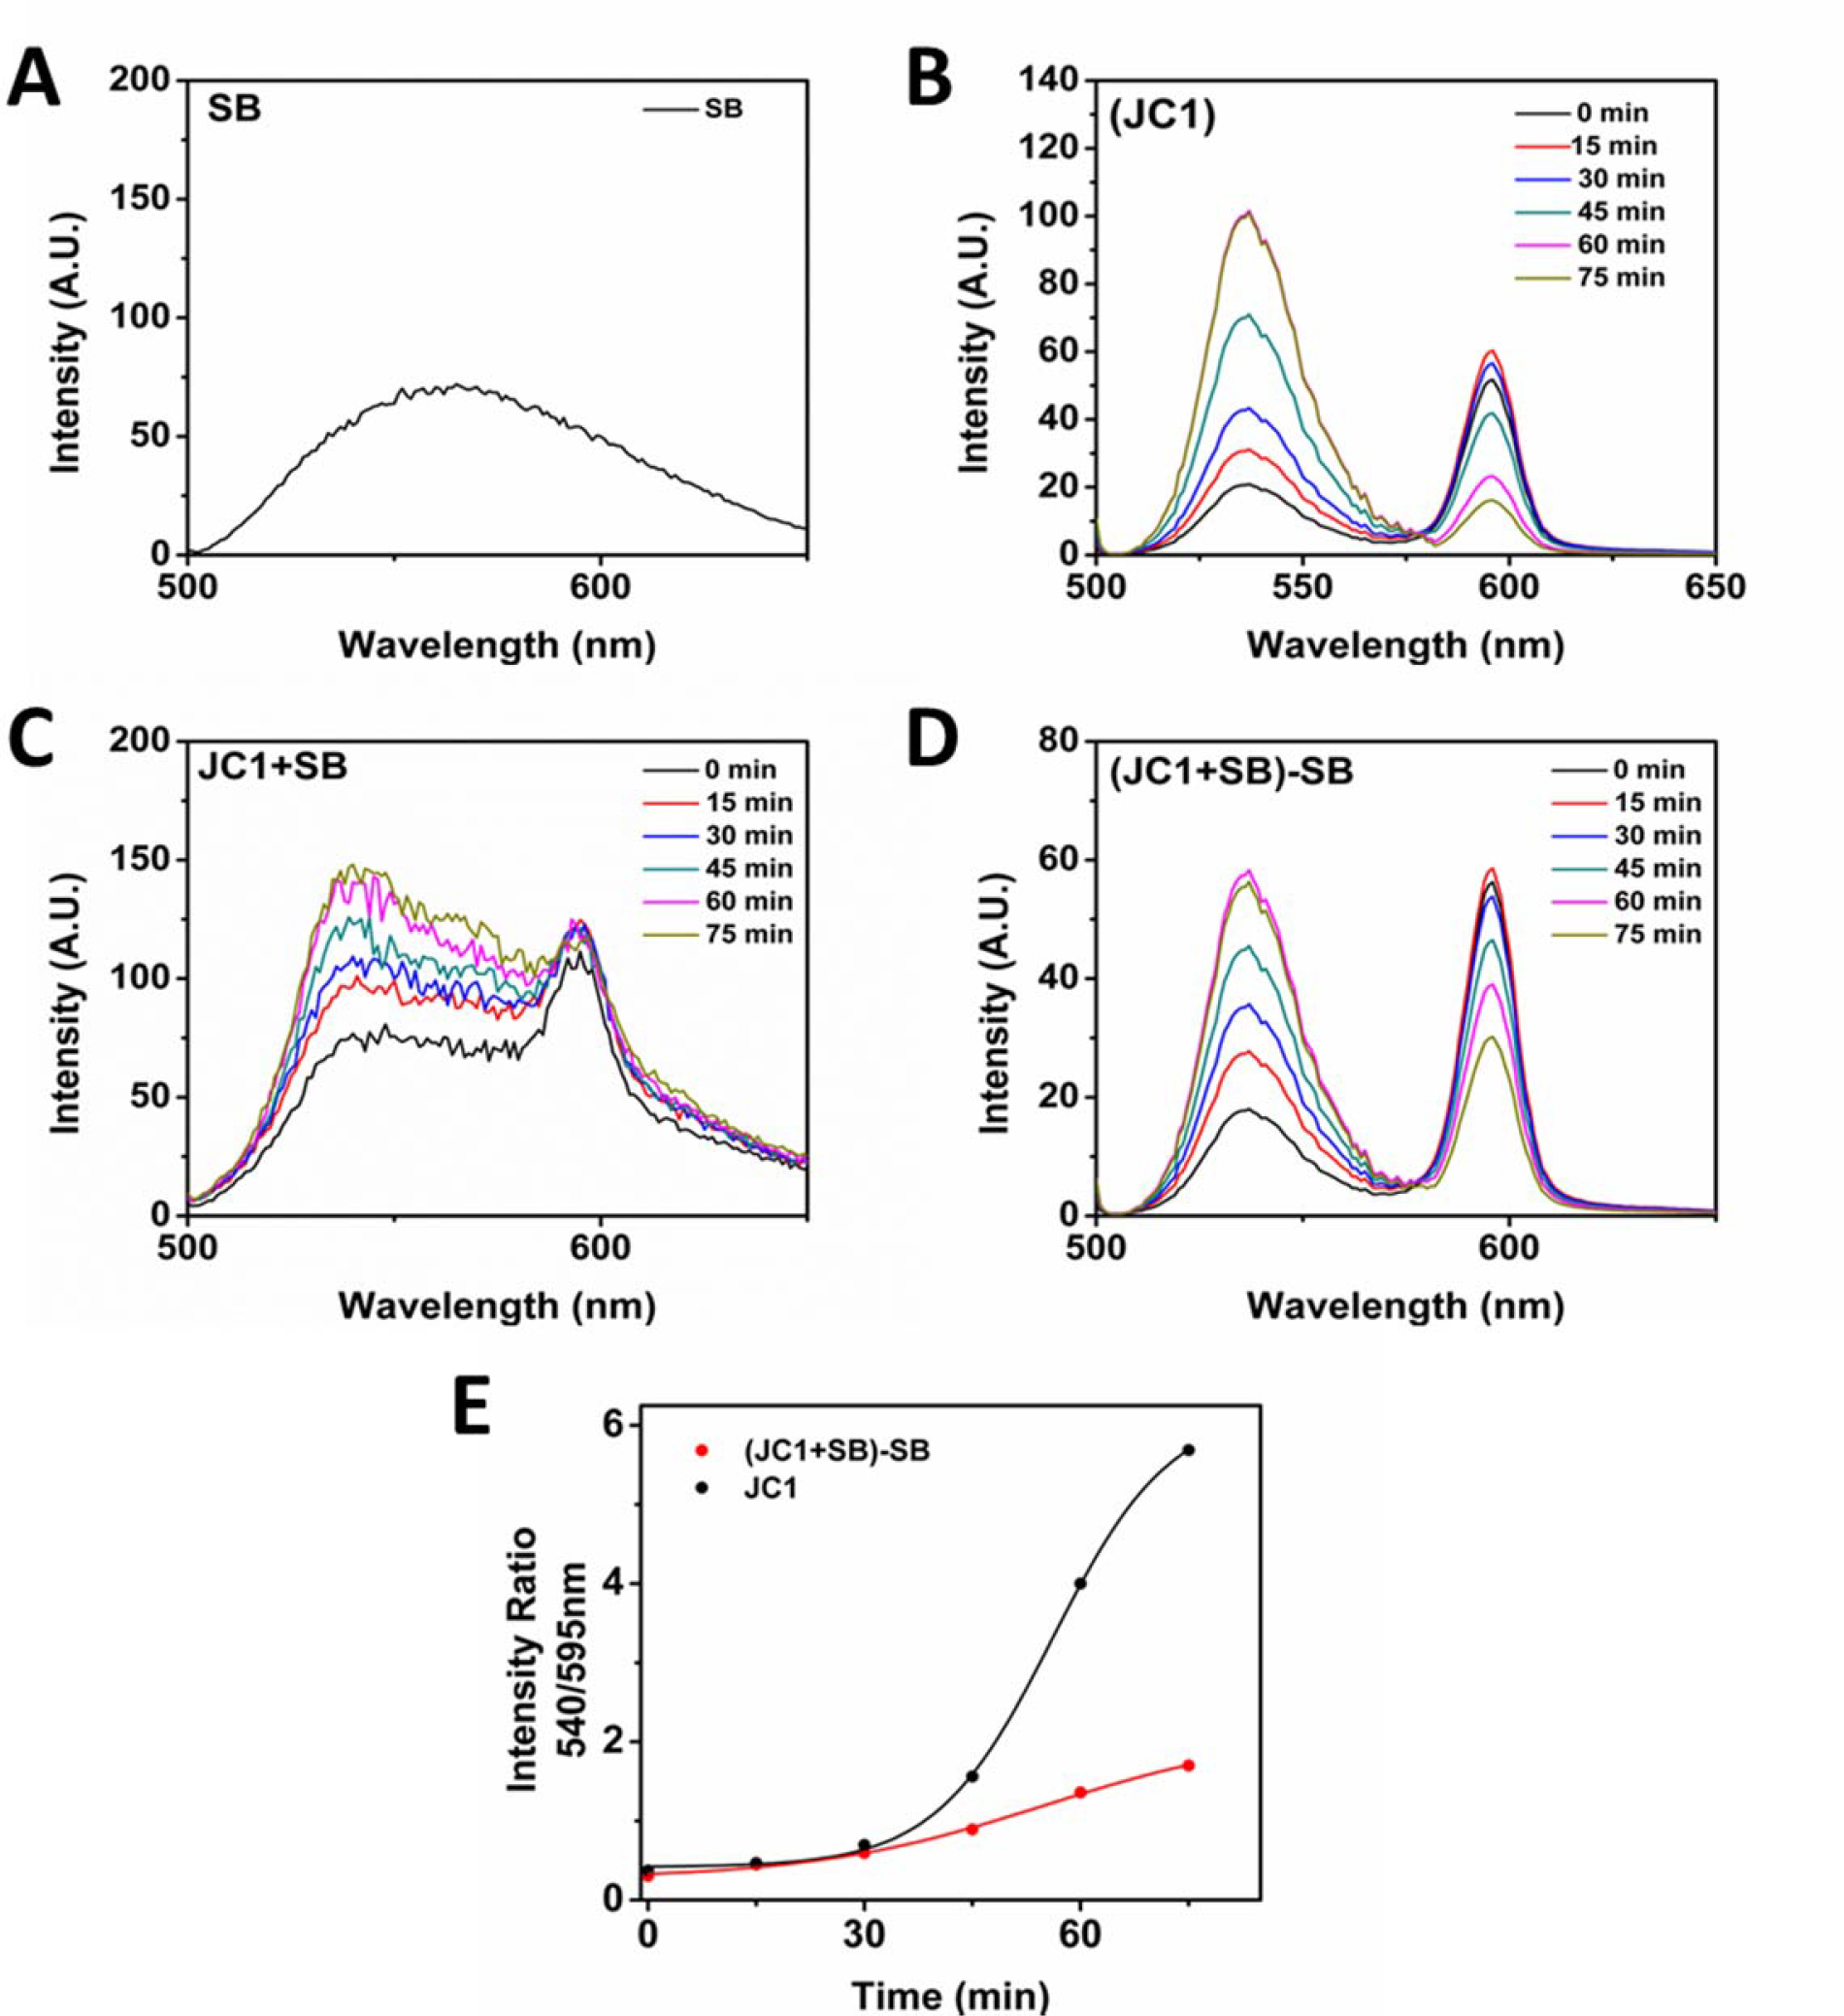
 Figure 1 of
Brooks, Mol Vis 2013; 19:1406-1412.
Figure 1 of
Brooks, Mol Vis 2013; 19:1406-1412.