Figure 7. Effects of semaphorin 3A on retina vascular endothelial growth factor-165 (VEGF165) secretion. This figure shows the VEGF165 in the oxygen-induced retinopathy (OIR) animal model (n=4) and the semaphorin 3A (Sema3A)-treated OIR model (n=4). The y-axis
represents the VEGF165 secretion ratios of the different treatment groups comparing to the 10% fetal bovine serum (FBS) treatment
group. Each experiment was repeated three separate times. All of the data are presented as the mean± standard error of the
mean (SEM).
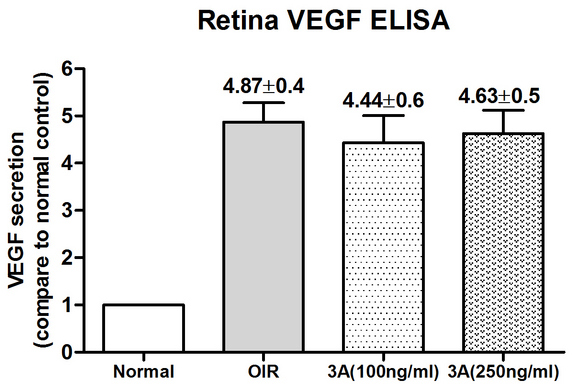
 Figure 7 of
Yu, Mol Vis 2013; 19:1397-1405.
Figure 7 of
Yu, Mol Vis 2013; 19:1397-1405.