Figure 3. Effects of semaphorin 3A on human umbilical vein endothelial cell tube formation. A: The panel shows the statistical analysis results, y-axis represents the length ratio comparing to control group; B: The panel is 0% fetal bovine serum (FBS)-treated group; C: The panel is 10% FBS culture group; D: The panel is vascular endothelial growth factor-165 (VEGF165)-treated group; E: The panel is semaphorin 3A (Sema3A) 250 ng/ml-treated group; F: The panel is Sema3A 500 ng/ml-treated group; G: The panel is Sema3A (250 ng/ml) and VEGF165-treated group; H: The panel is Sema3A (500 ng/ml) and VEGF165-treated group. All of the pictures (panel B to H) were taken as the magnificent of 10× by Zeiss light microscopy. All of the data were repeated at least three times, and
were presented as mean± standard error of the mean (SEM). *p<0.05; **p<0.01.
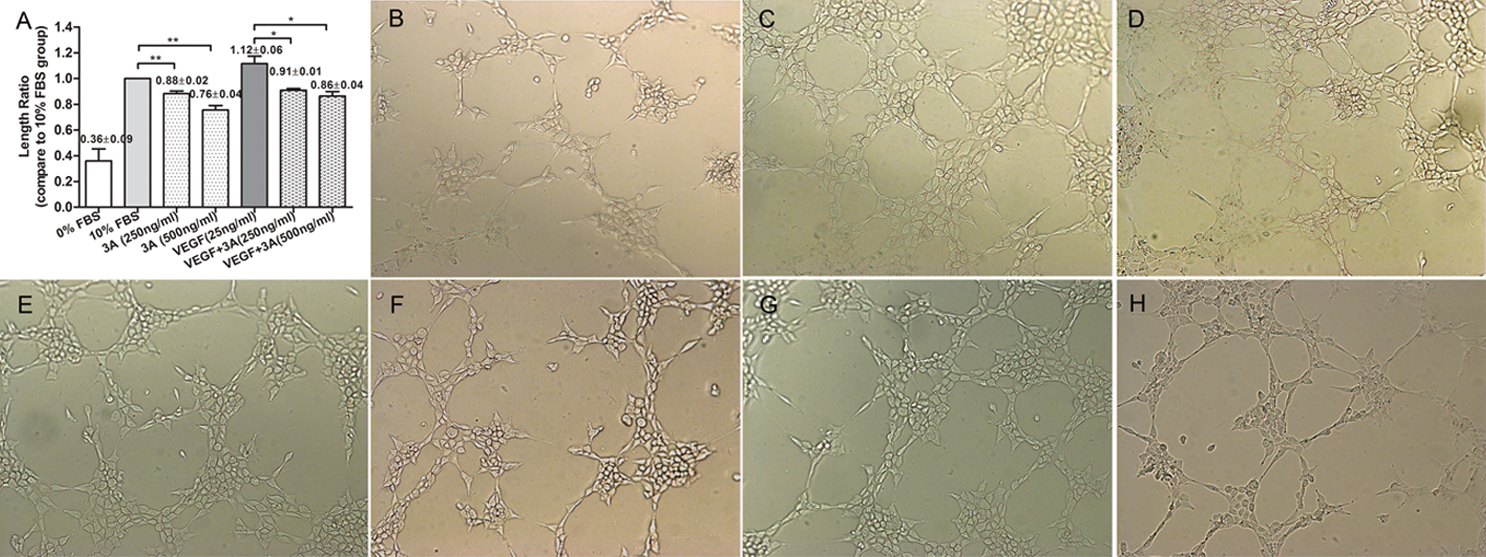
 Figure 3 of
Yu, Mol Vis 2013; 19:1397-1405.
Figure 3 of
Yu, Mol Vis 2013; 19:1397-1405.