Figure 2. Effects of semaphorin 3A on the migration of human umbilical vein endothelial cells. A: The panel is statistical analysis results, y-axis represents the migration ratio of the different treatment groups comparing
to the 10% fetal bovine serum (FBS) treatment group. B: The panel is 0% FBS-treated group; C: The panel is 10% FBS culture group. D: The panel is vascular endothelial growth factor-165 (VEGF165)-treated group: E: The panel is semaphorin 3A (Sema3A) 500ng/ml-treated group. F: The panel is Sema3A and VEGF165-treated group. In panels B to F, the cell nuclei were stained with 4',6-diamidine-2'-phenylindole dihydrochloride (DAPI), which is shown as blue dots. All
of the pictures (panel B to F) were taken as the magnificent of 10× by Zeiss florescence microscopy. All of the data were repeated at least three times,
and were presented as mean± standard error of the mean (SEM). *p<0.05; **p<0.01; ***p<0.001.
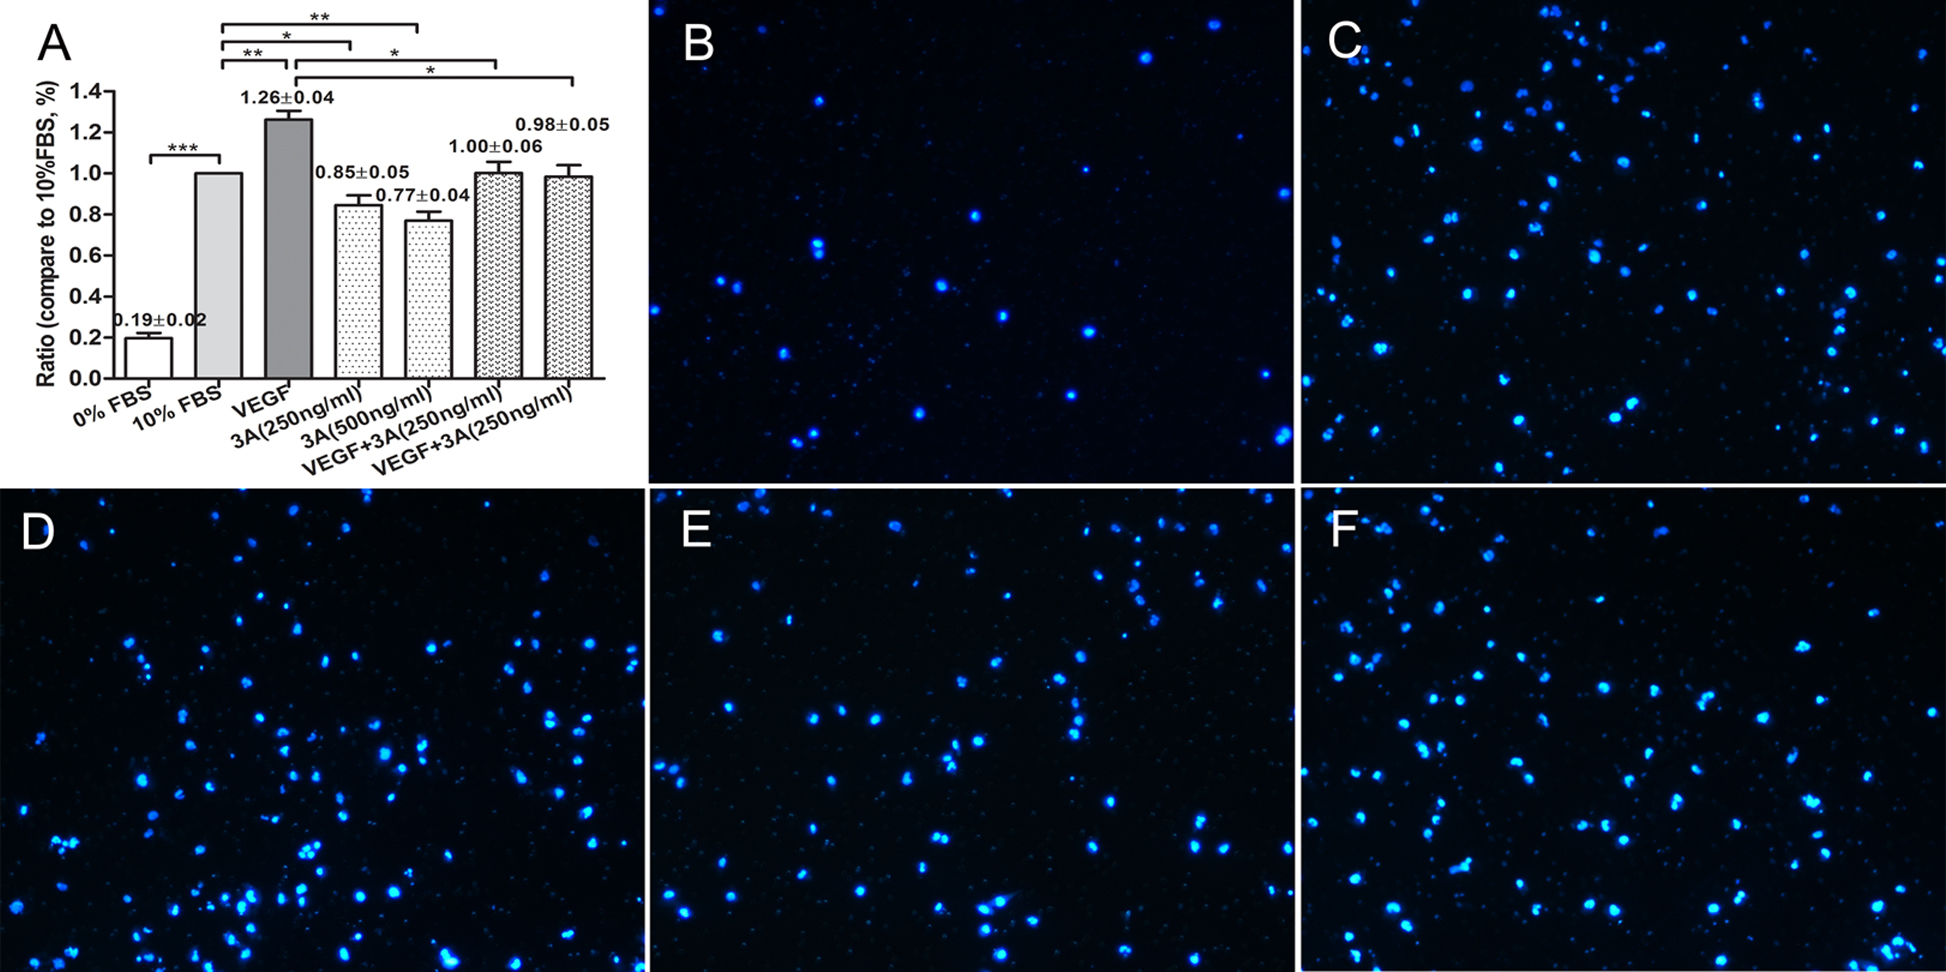
 Figure 2 of
Yu, Mol Vis 2013; 19:1397-1405.
Figure 2 of
Yu, Mol Vis 2013; 19:1397-1405.