Figure 3. Double-label immunohistochemistry reveals RIT2 expression in neuronal cells in the inner nuclear layer (INL). Images are double
labeling of RIT2 with the horizontal cell marker LIM1 (A, F, K), the bipolar marker VSX2 (B, G, L), markers for a mixed population of horizontal, amacrine, and ganglion cells calbindin D28 (C, H, M) and PAX6 (D, I, N). Non-neuronal Müller glia was detected with an antibody against vimentin (E, J, O). Color images in the top panels represent merged images of double labeling for RIT2 and one of the cell-type-specific markers
(A–E). Black and white images in the middle and bottom panels show single channel images of RIT2 (F–J) and the cell-type-specific markers (K–O), respectively. Arrows indicate representative cells that exhibit colocalization of RIT2 and each cell-type-specific marker,
which is shown in a higher magnification in the insets. Scale bar: 20 μm. GCL, ganglion cell layer; INL, inner nuclear layer;
ONL, outer nuclear layer.
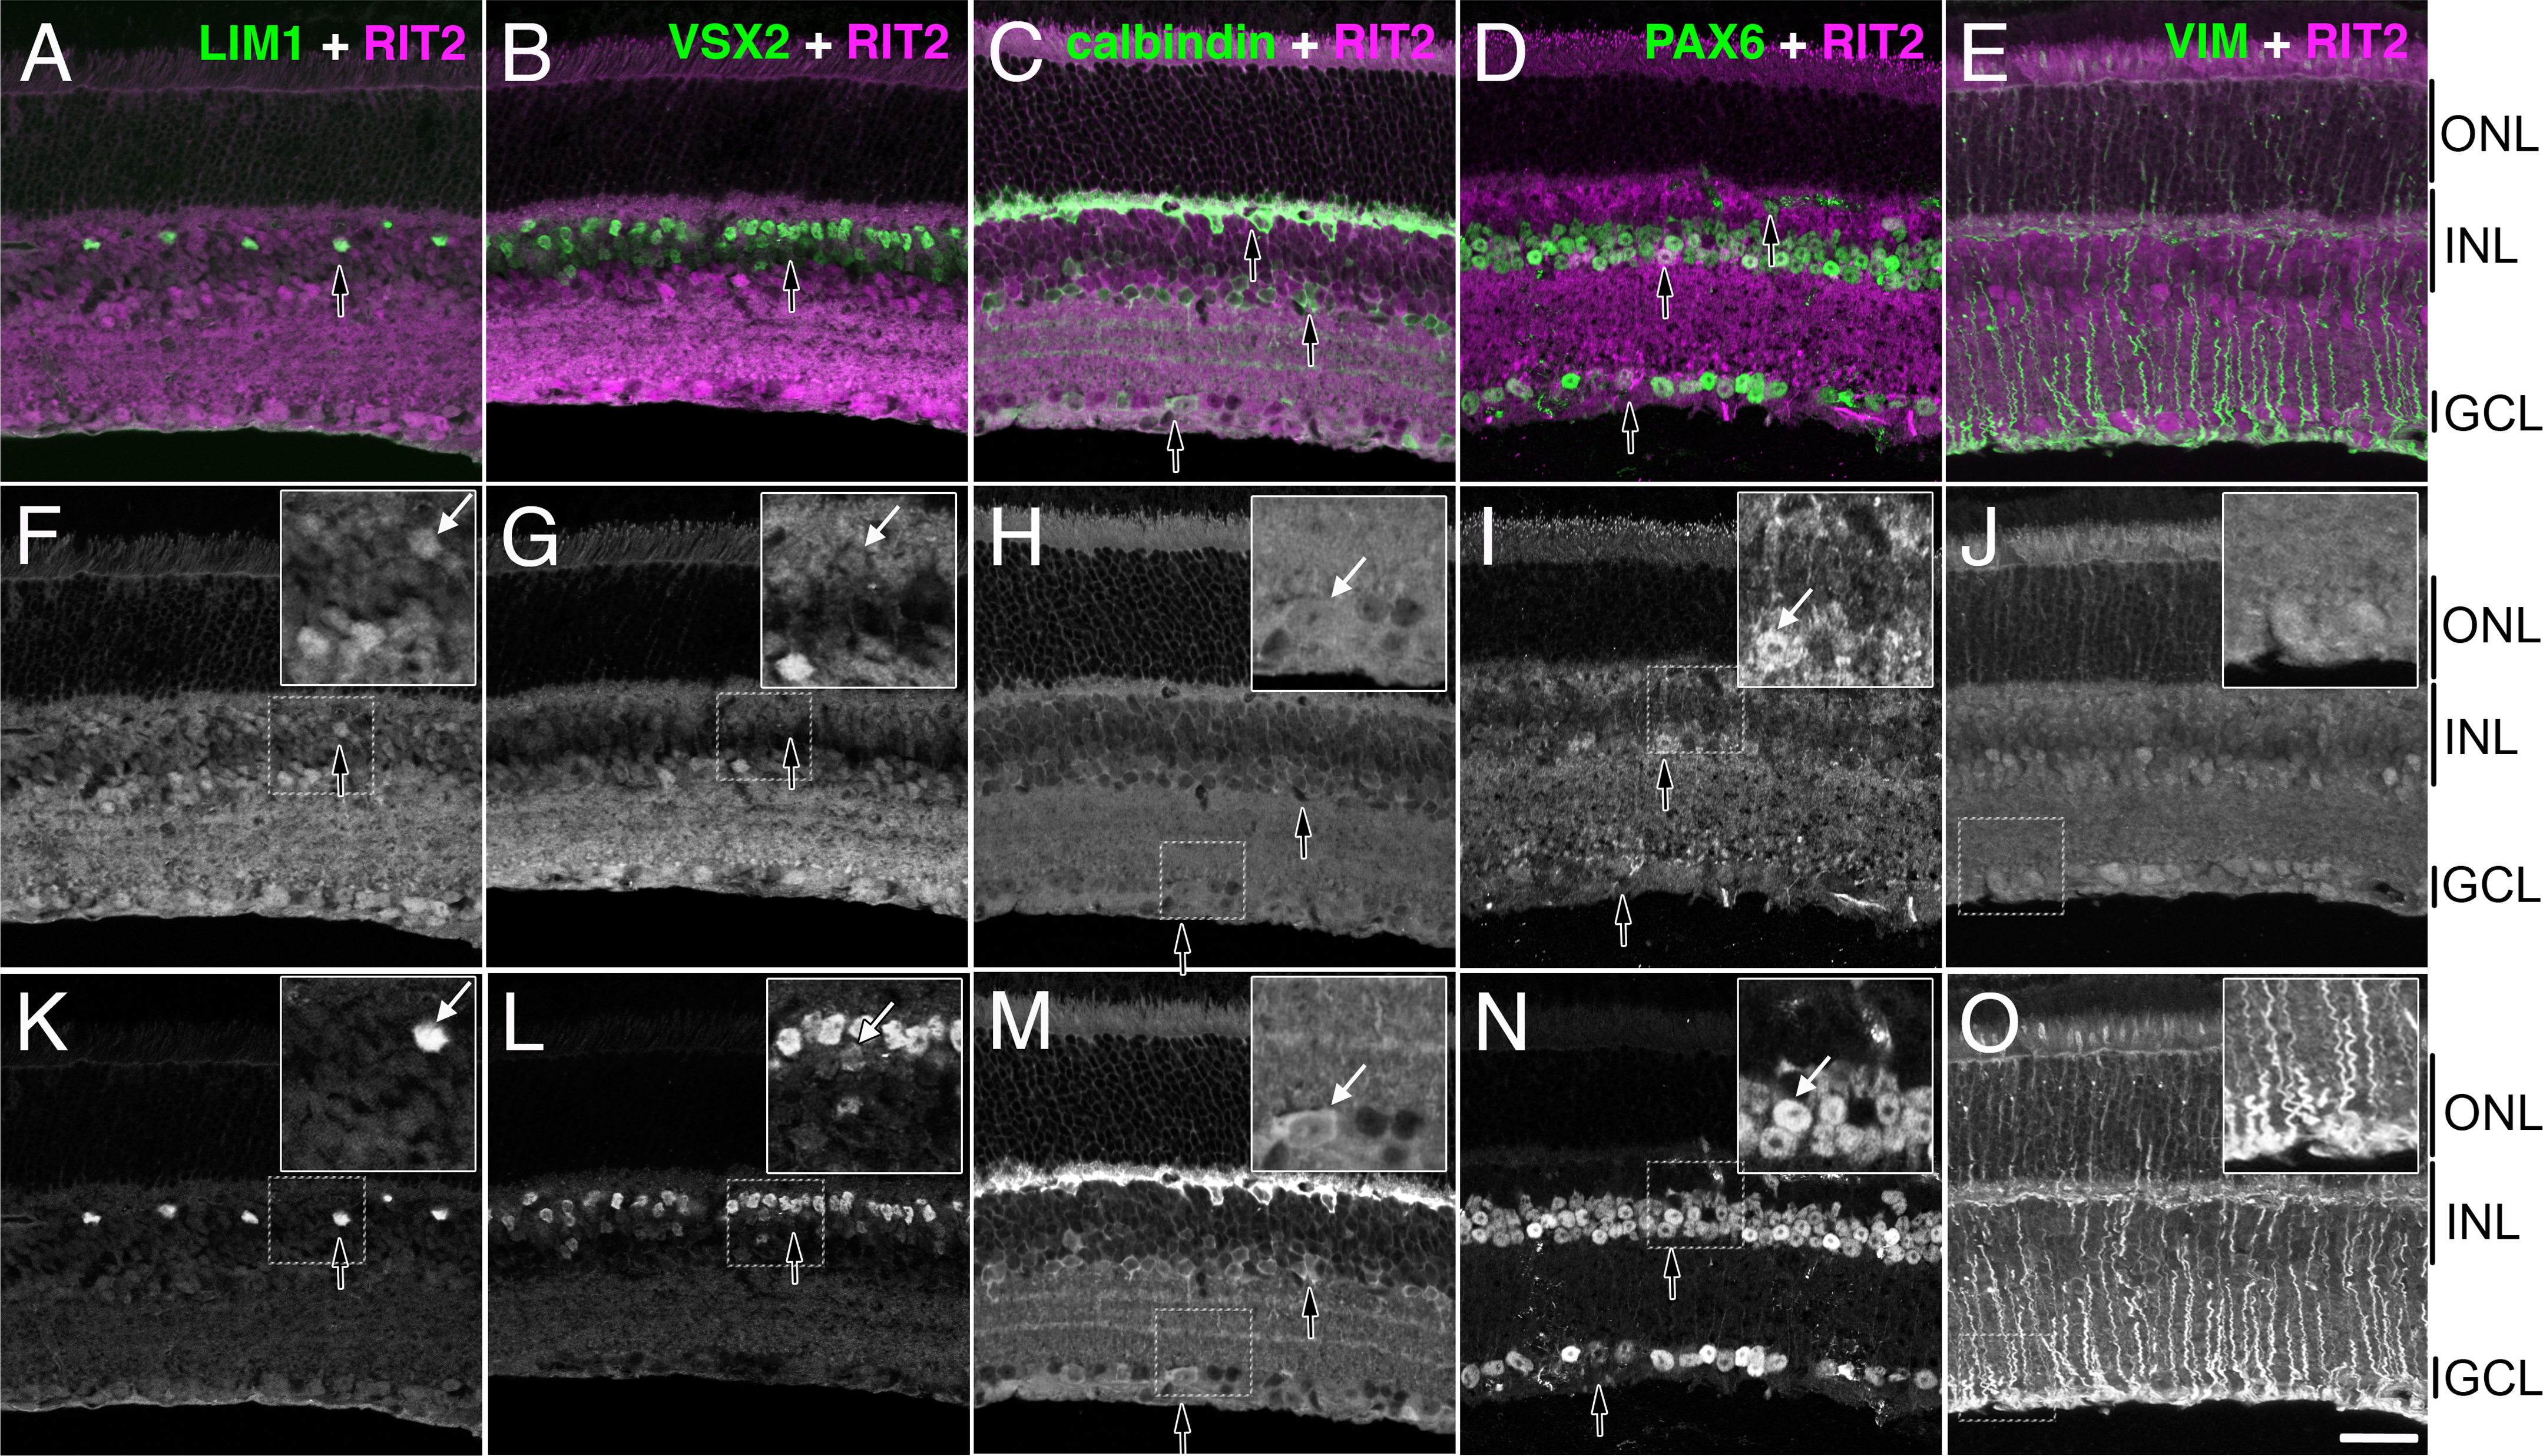
 Figure 3 of
Zhang, Mol Vis 2013; 19:1371-1386.
Figure 3 of
Zhang, Mol Vis 2013; 19:1371-1386.