Figure 2. Expression of Rit2 mRNA and protein in the mouse retina. The top panels show immunohistochemistry of retinal flat-mounts (A-D) and retinal sections (E-H). Images are staining with anti-RIT2 antibody (A, E), anti-POU4F2 antibody (B, F), merged image of RIT2 and POU4F2 (C, G), and nuclear staining by 4', 6-diamidino-2-phenylindole (DAPI; D, H). RIT2-positive cells are more numerous than POU4F2-positive RGCs. E: RIT2 protein is detected in the ganglion cell layer (GCL), inner plexiform layer (IPL), and cells in the inner nuclear layer
(INL). Short arrowheads point to RIT2-positive cells located at the inner border of the INL; long arrowheads point to RIT2-positive
cells at the outer aspect of the INL. Scale bar: 50 μm. I: This panel shows Rit2 mRNA expression. Laser capture microdissection was used to collect tissues of GCL, INL, and outer nuclear layer (ONL) from
mouse retinal sections, and RNA of each layer was analyzed by reverse transcription-quantitative polymerase chain reaction.
The mRNA level of Rit2, Pou4f1, and Pou4f2 was normalized by that of Gapdh. J: RIT2 protein levels were analyzed at different ages. Protein lysates were prepared from mouse retinas at postnatal day 2
(P2), P5, P15, and adult (8 weeks old), and analyzed by western blotting with anti-RIT2 antibody and anti-α tubulin antibody
for control. Protein signals were visualized by chemiluminescence with X-ray films. K: This panel shows relative quantification of RIT2 protein levels. Western blot signals on the X-ray films were scanned and
analyzed with ImageJ software. The signal intensity of RIT2 was normalized by that of α tubulin and presented as the RIT2/tubulin
ratio. RIT2 protein levels increased from P2 to adults by more than 15 fold.
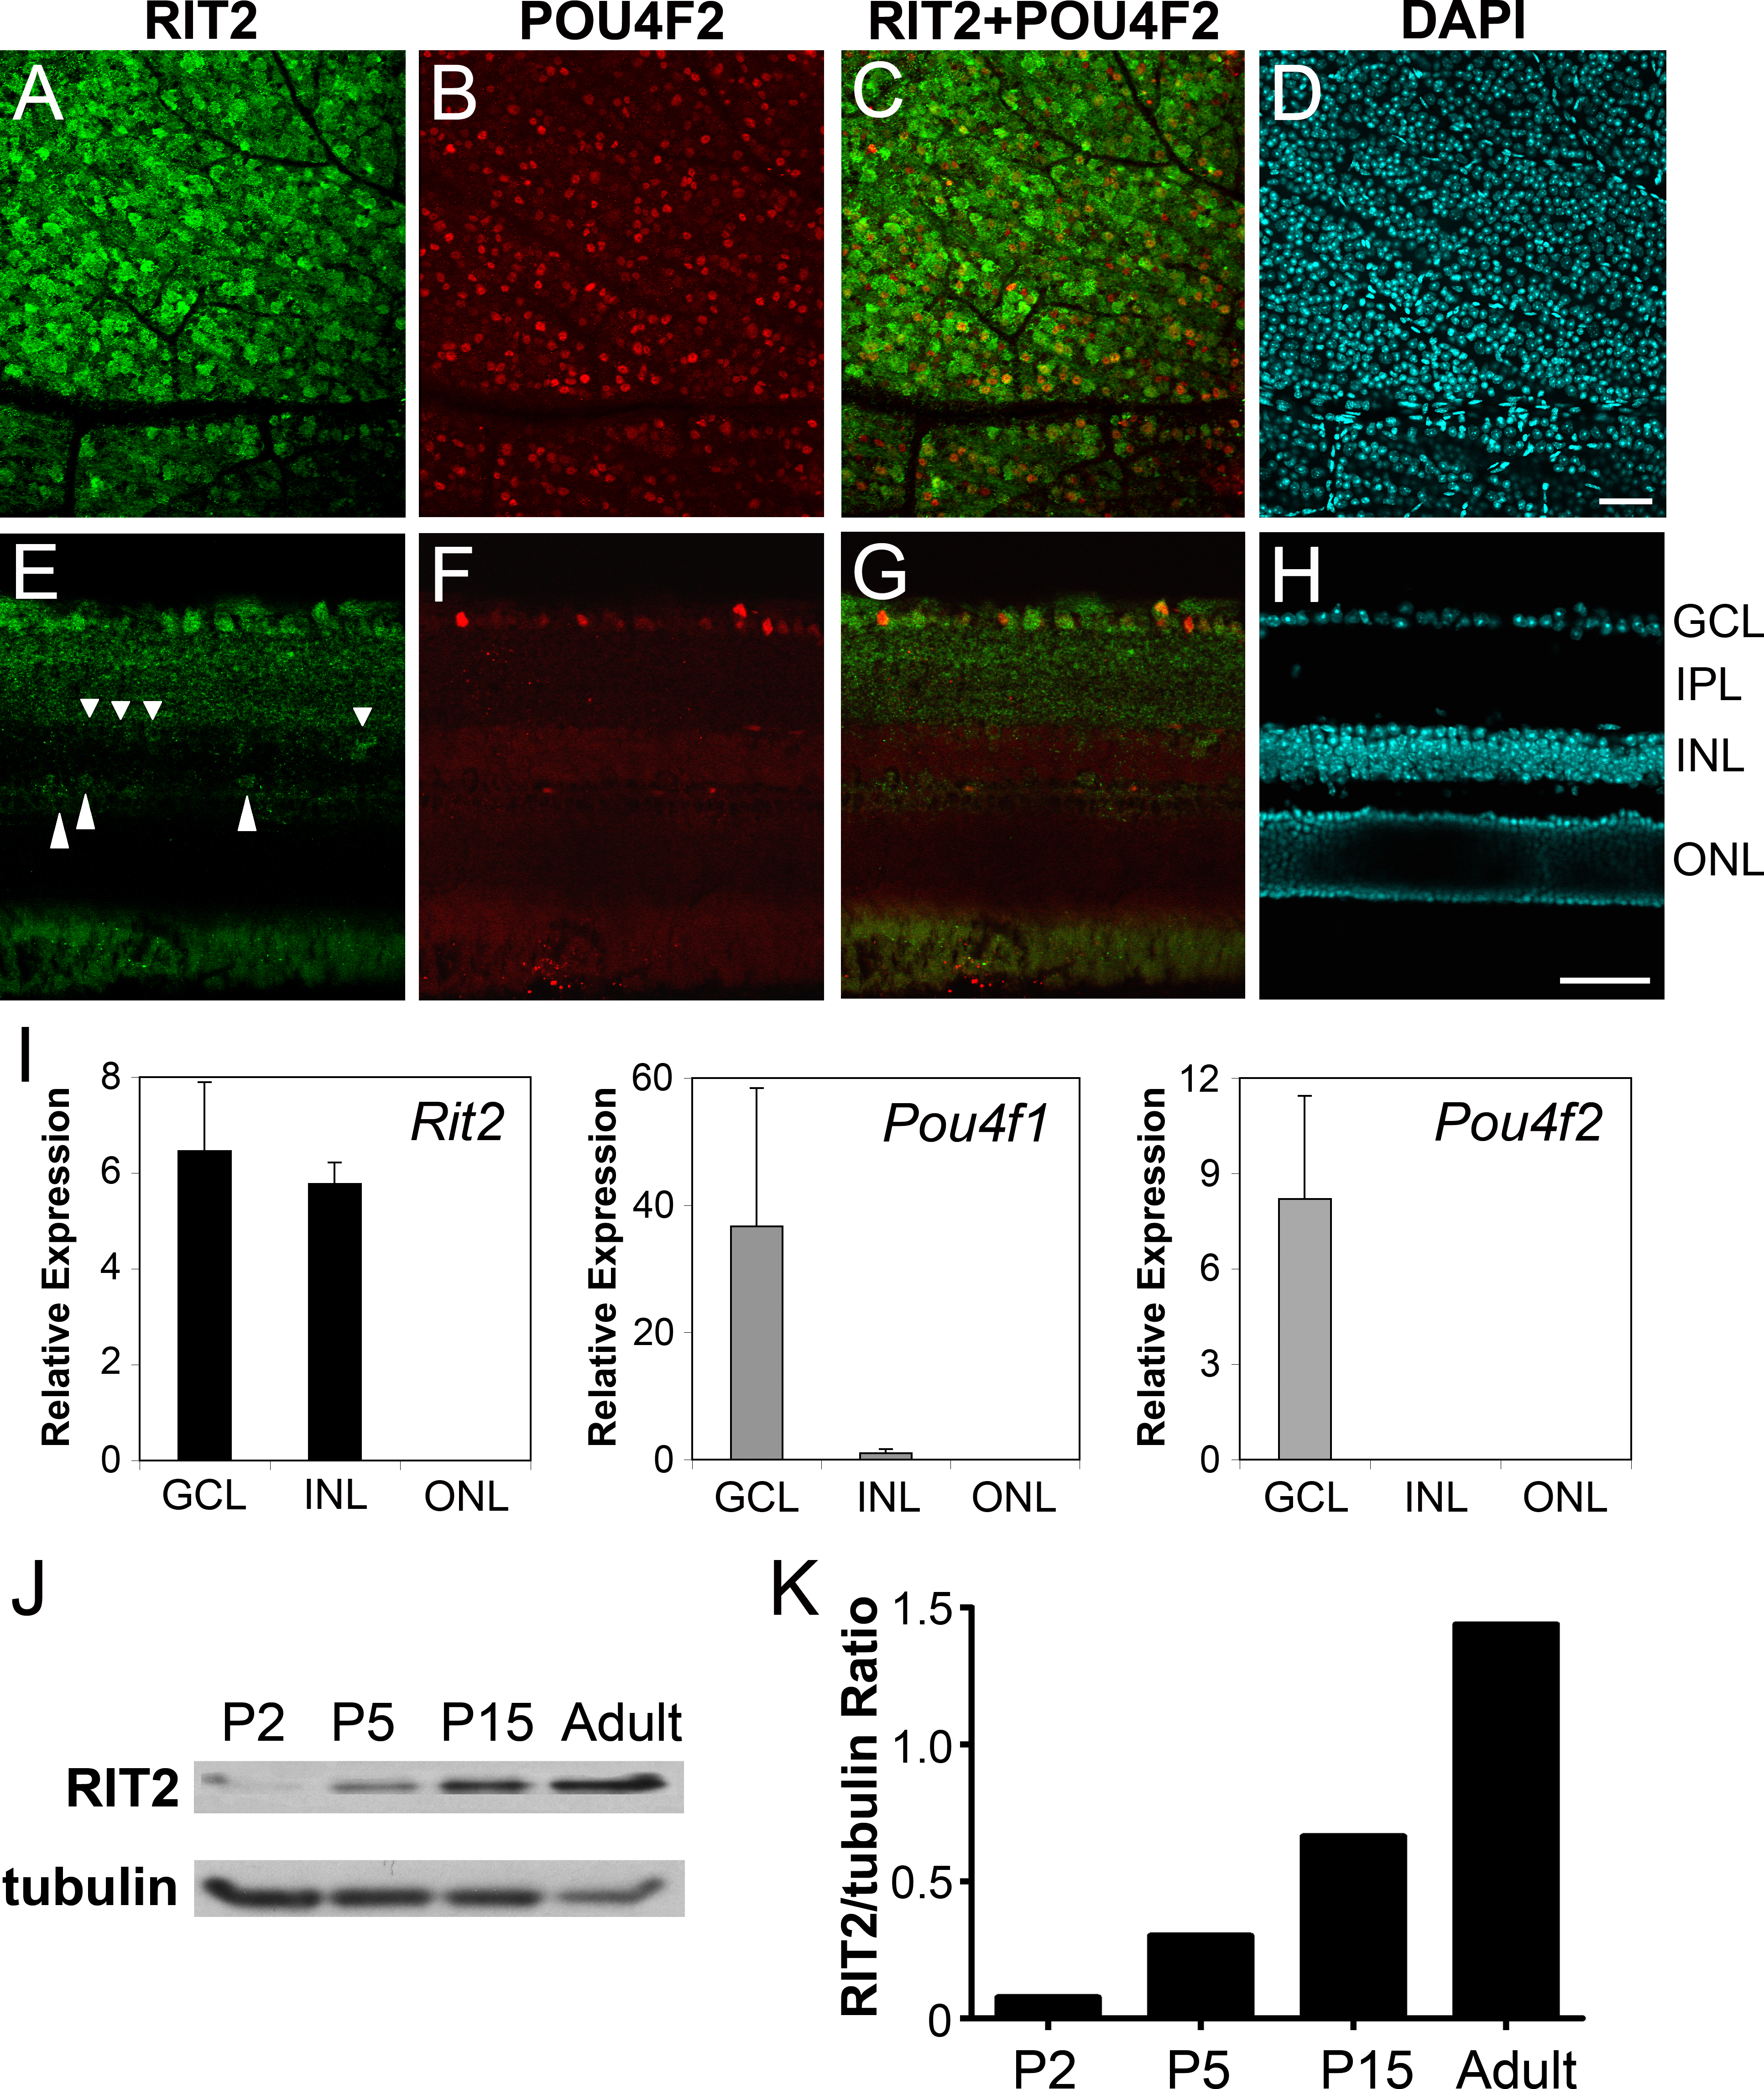
 Figure 2 of
Zhang, Mol Vis 2013; 19:1371-1386.
Figure 2 of
Zhang, Mol Vis 2013; 19:1371-1386.