Figure 1. The 5′-upstream region of human RIT2 drives expression in neuronal cells. A: This panel shows morphology of human neuroblastoma cells. Cells were grown as described in Methods and photographed with
an inverted microscope. Cell lines used are SK-N-MC (labeled as MC), SK-N-AS (AS), and SK-N-DZ (DZ). B: This panel shows endogenous RIT2 expression. Total RNA was extracted from subconfluent cell cultures and analyzed by reverse transcription-polymerase chain
reaction. S16 expression was used as a normalization control. Samples are SK-N-MC (labeled as MC), SK-N-AS (AS), SK-N-DZ (DZ), HEK293 (293),
and human brain RNA as the positive control (brain). C: RIT2 promoter activity was analyzed by transfection. A luciferase construct containing a 5′-upstream fragment of RIT2, either –1290 to +76 (labeled as −1290, open column) or –374 to +76 bp (−374, solid column), or empty pGL2-Basic vector as
the background control was transiently transfected into the indicated cells together with pCMV-lacZ as internal control for transfection efficiency. Luciferase activities were normalized with β-galactosidase activities, and
relative luciferase activities were calculated as the ratio of the normalized luciferase activity with constructs containing
RIT2 upstream fragments to that with empty pGL2-Basic. The values represent the means and standard deviation (error bar).
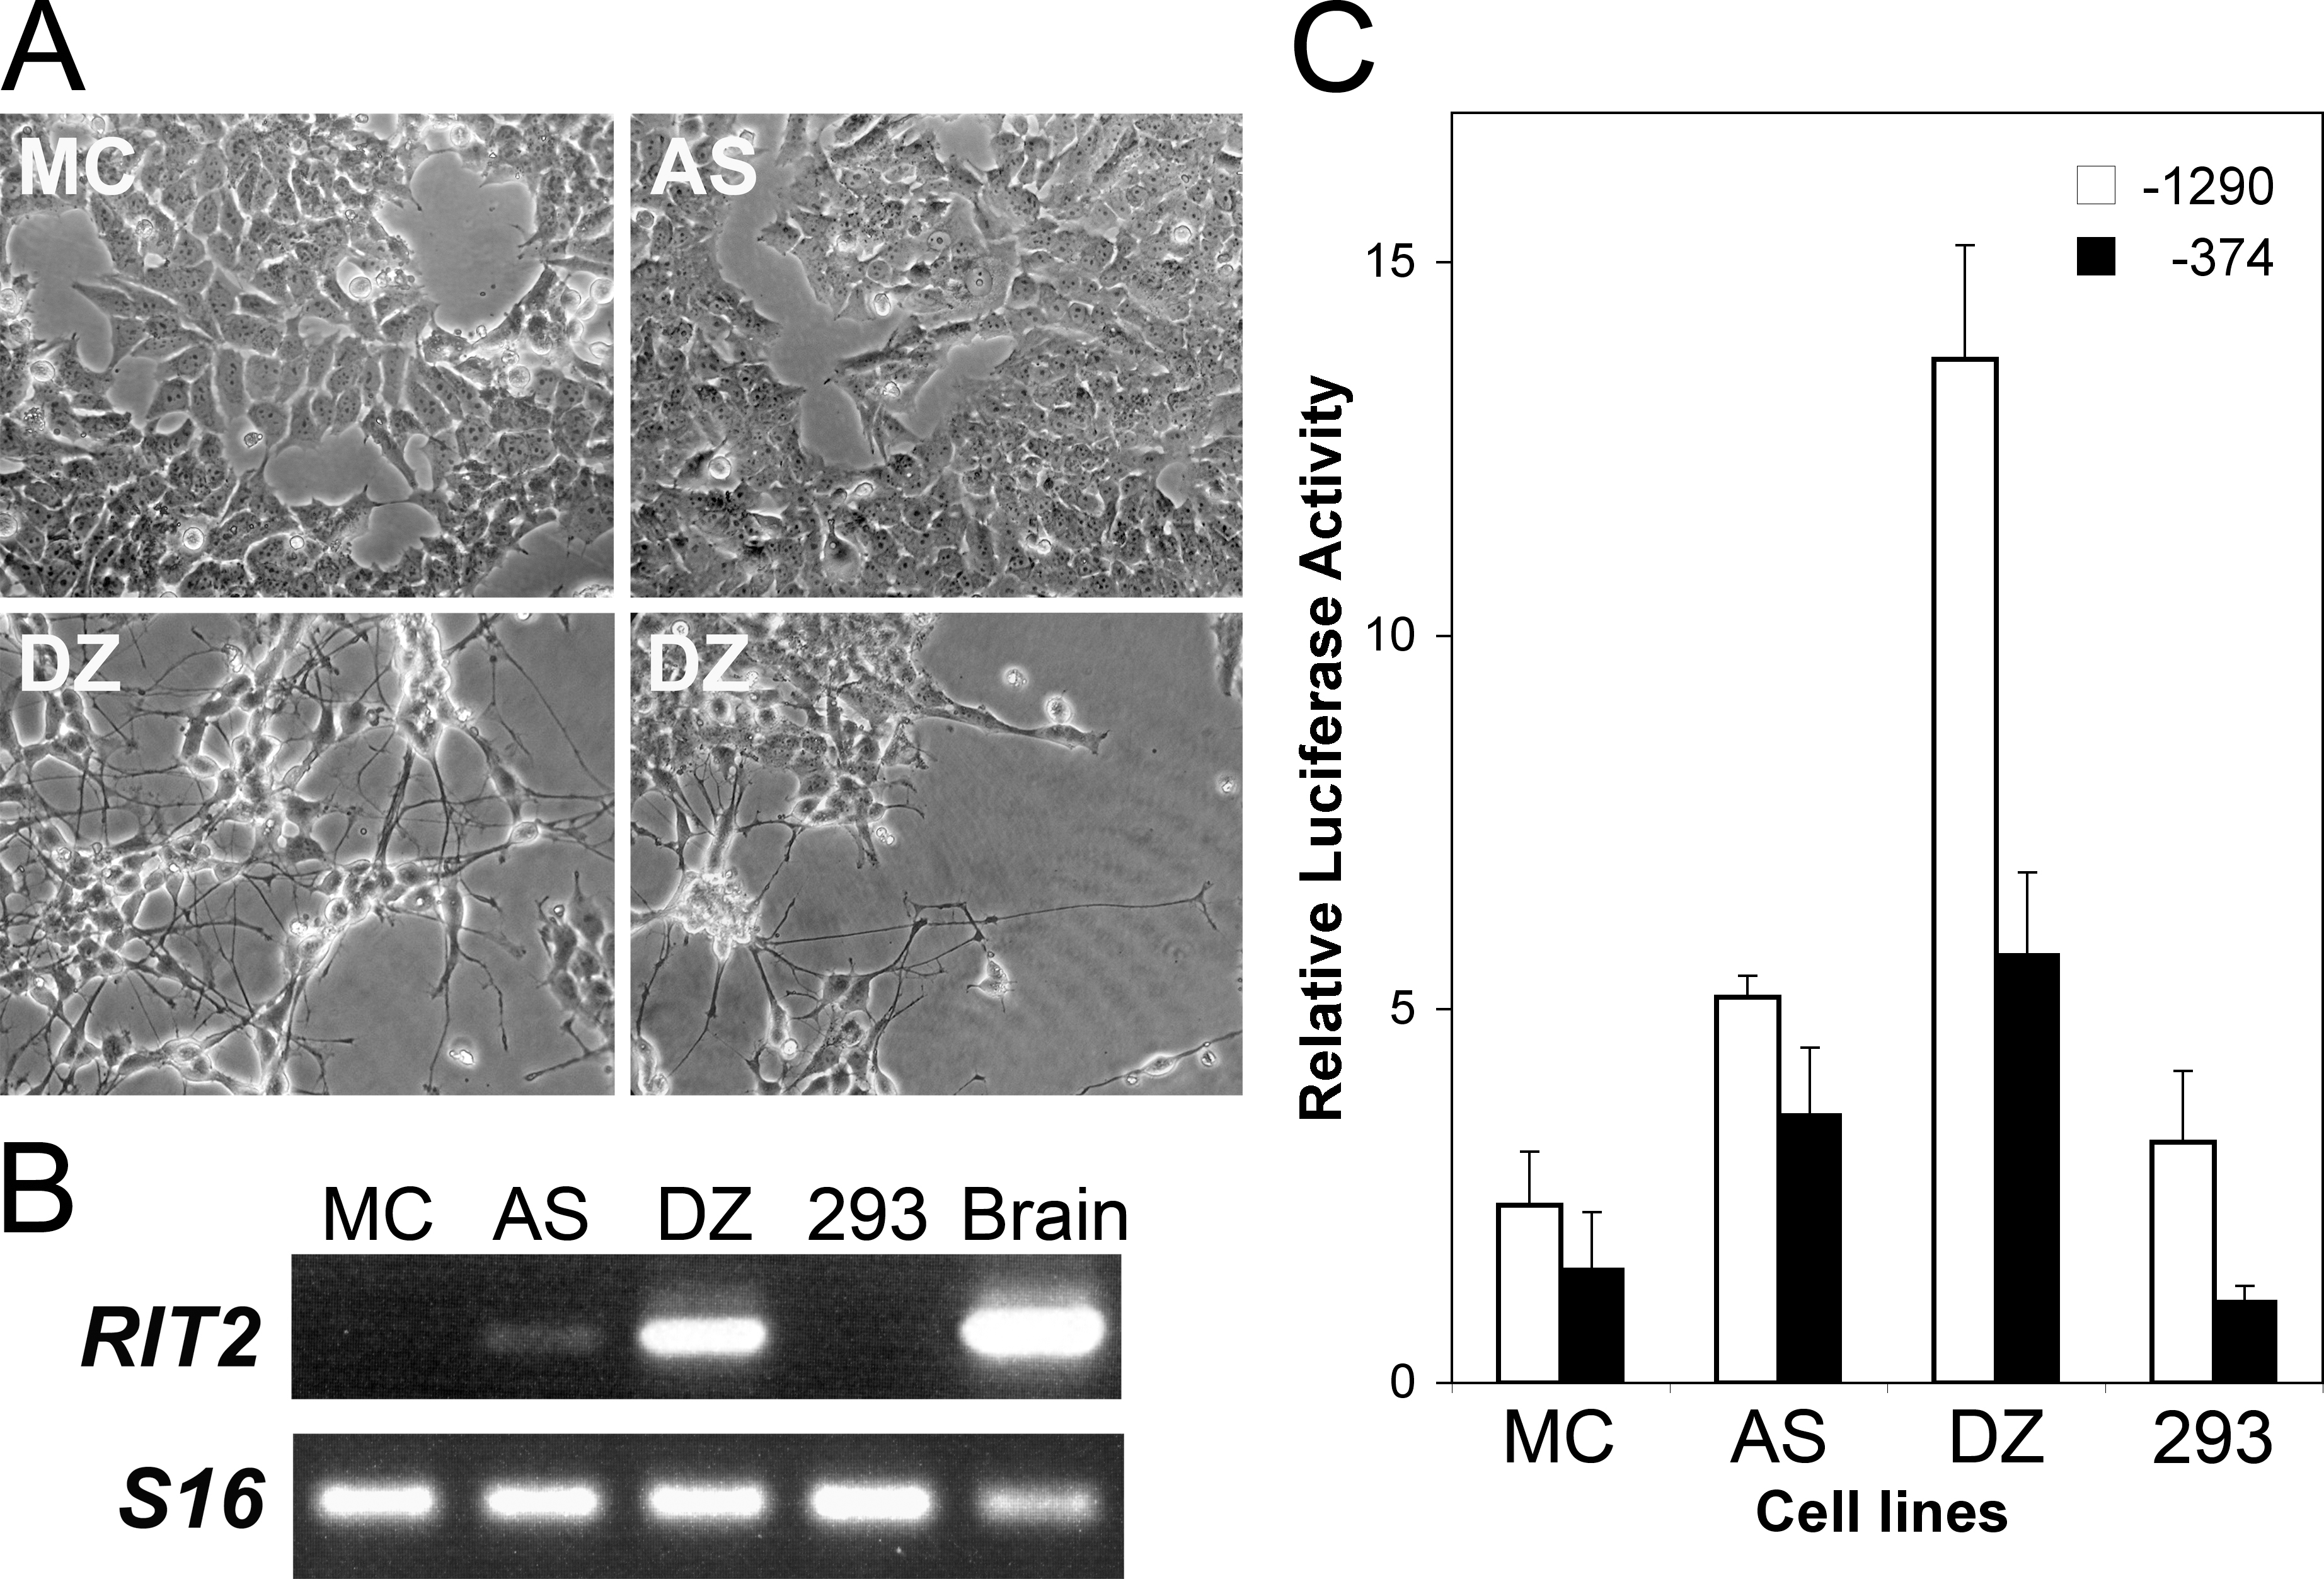
 Figure 1 of
Zhang, Mol Vis 2013; 19:1371-1386.
Figure 1 of
Zhang, Mol Vis 2013; 19:1371-1386.