Figure 3. Relative expression of rad1, cytochrome oxidase subunit 2, stromelysin 1/2 alpha, vascular endothelial growth factor receptor
1 (VEGFR1), glutathione peroxidase 1, and avidin genes after quantitative real-time (qRT)-PCR 0, 1, 3, and 5 days after lentectomy
for dorsal and ventral pigmented epithelial cells (PECs) normalized with housekeeping gene ribosomal protein large 27 (RPL27).
One asterisk (*) indicates p value smaller than 0.05 (p<0.05). Three asterisks (***) indicate p value smaller than 0.001 (p<0.001).
Asterisk located above the expression columns indicates significance between the sample at a particular time point and the
intact iris. Asterisk located above the black line indicates significance between the samples of the same day. The statistical
analysis used is the Student t test. Bars on graph indicate standard deviation.
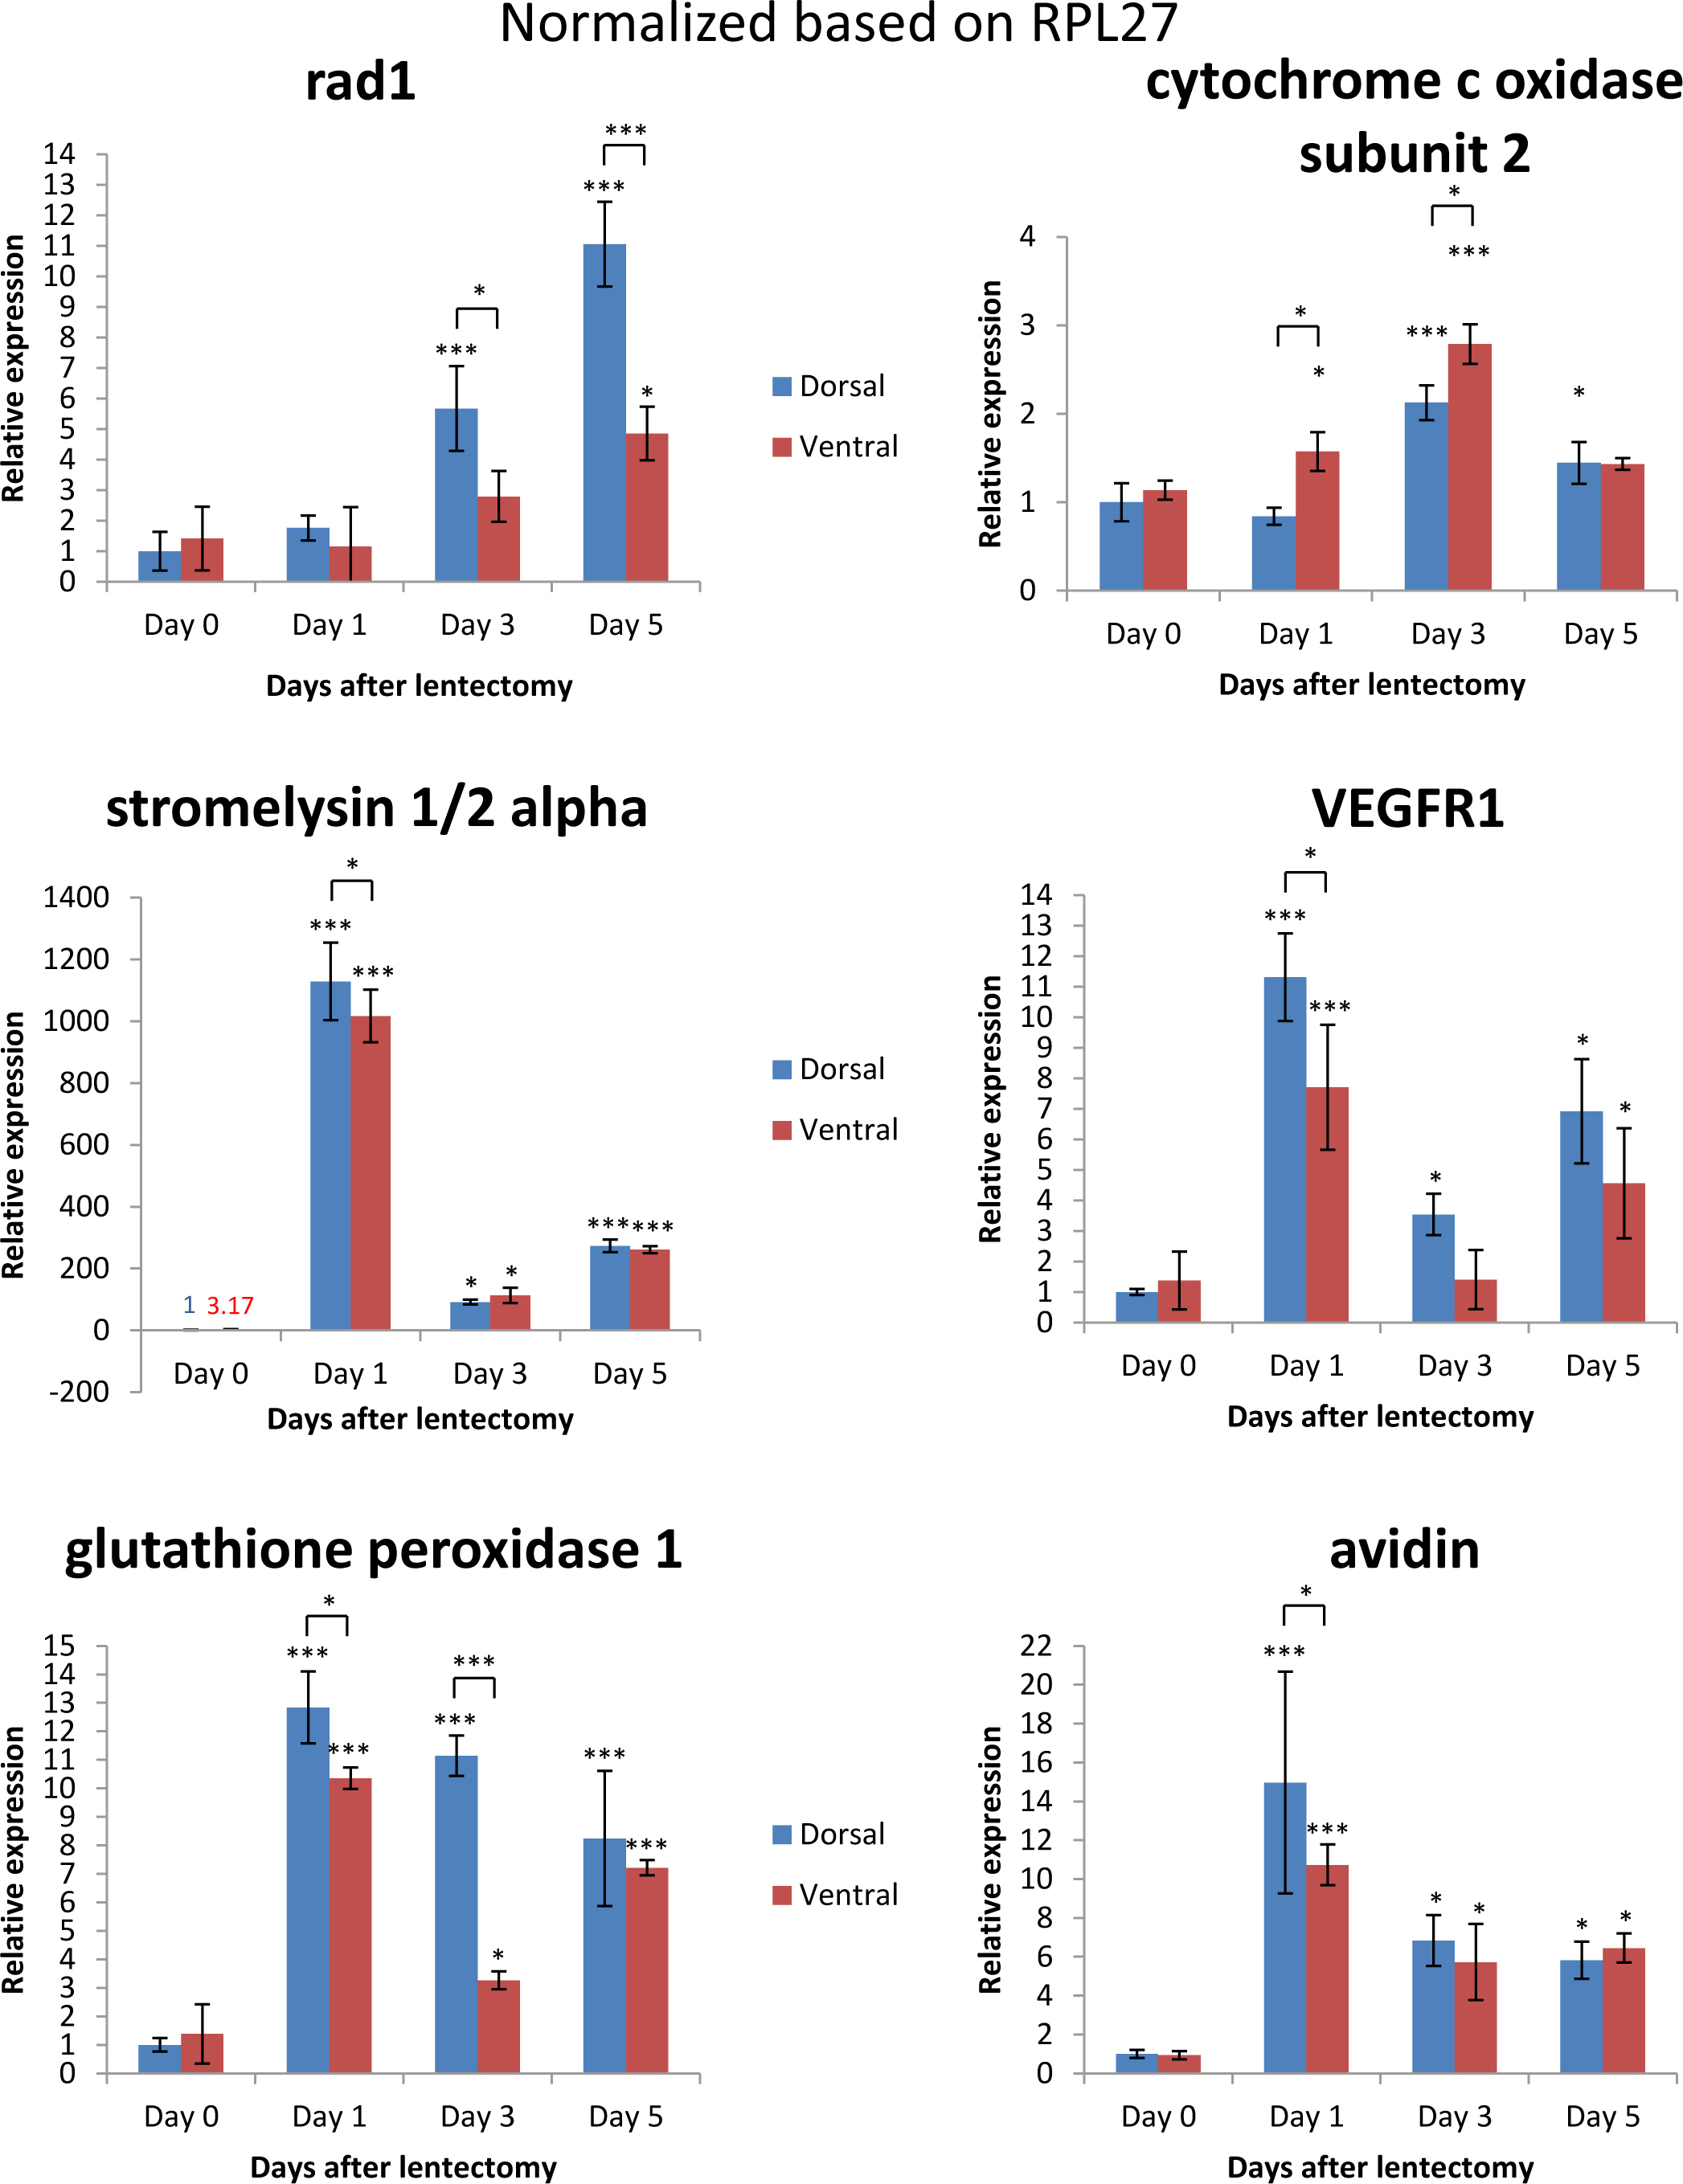
 Figure 3 of
Sousounis, Mol Vis 2013; 19:135-145.
Figure 3 of
Sousounis, Mol Vis 2013; 19:135-145.