Figure 2. Expression comparison among dorsal/ventral iris in selected time points. A: Venn diagram for contigs consistently up- or downregulated in dorsal or ventral iris during all the time points. D up: Contigs
upregulated in the dorsal iris during all the time points. D down: Contigs downregulated in the dorsal iris during all the
time points. V up: Contigs upregulated in the ventral iris during all the time points. V down: Contigs downregulated in the
ventral iris during all the time points. B: Venn diagrams for contigs that are downregulated in the dorsal iris and the ventral iris at day 1, and upregulated in the
dorsal iris at day 5, and the opposite. Annotated genes are included below each Venn graph. D: dorsal iris; V: ventral iris.
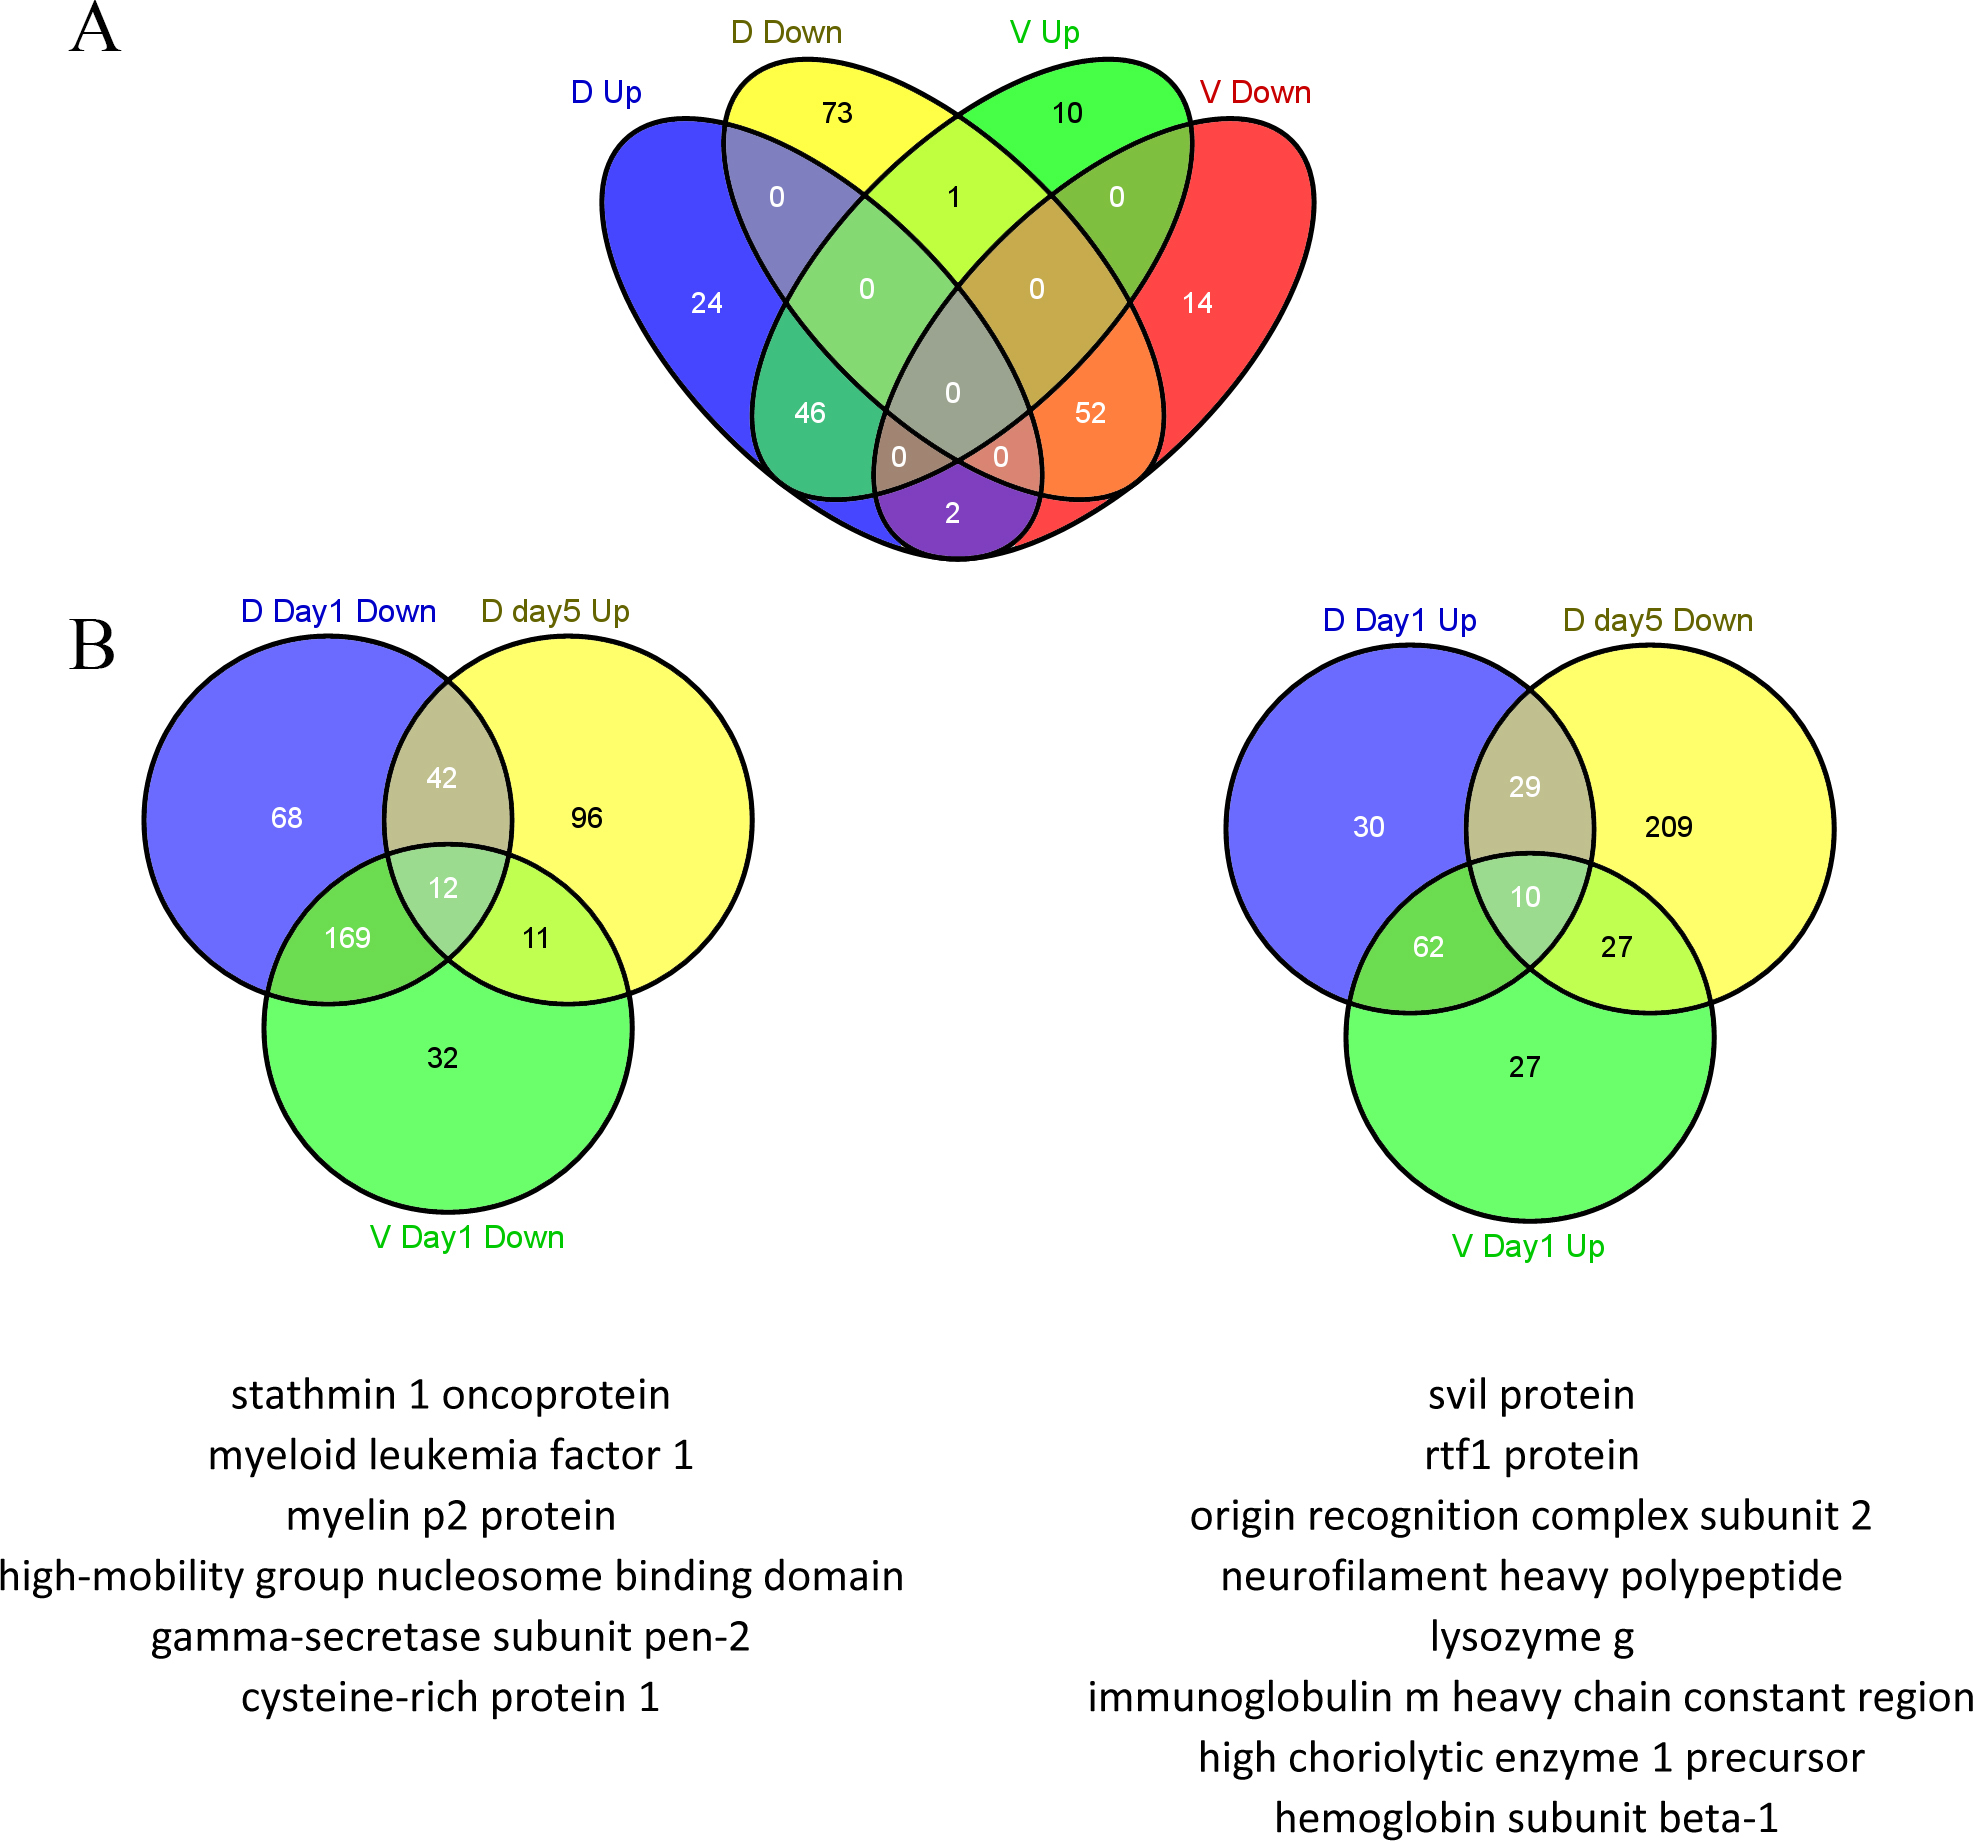
 Figure 2 of
Sousounis, Mol Vis 2013; 19:135-145.
Figure 2 of
Sousounis, Mol Vis 2013; 19:135-145.