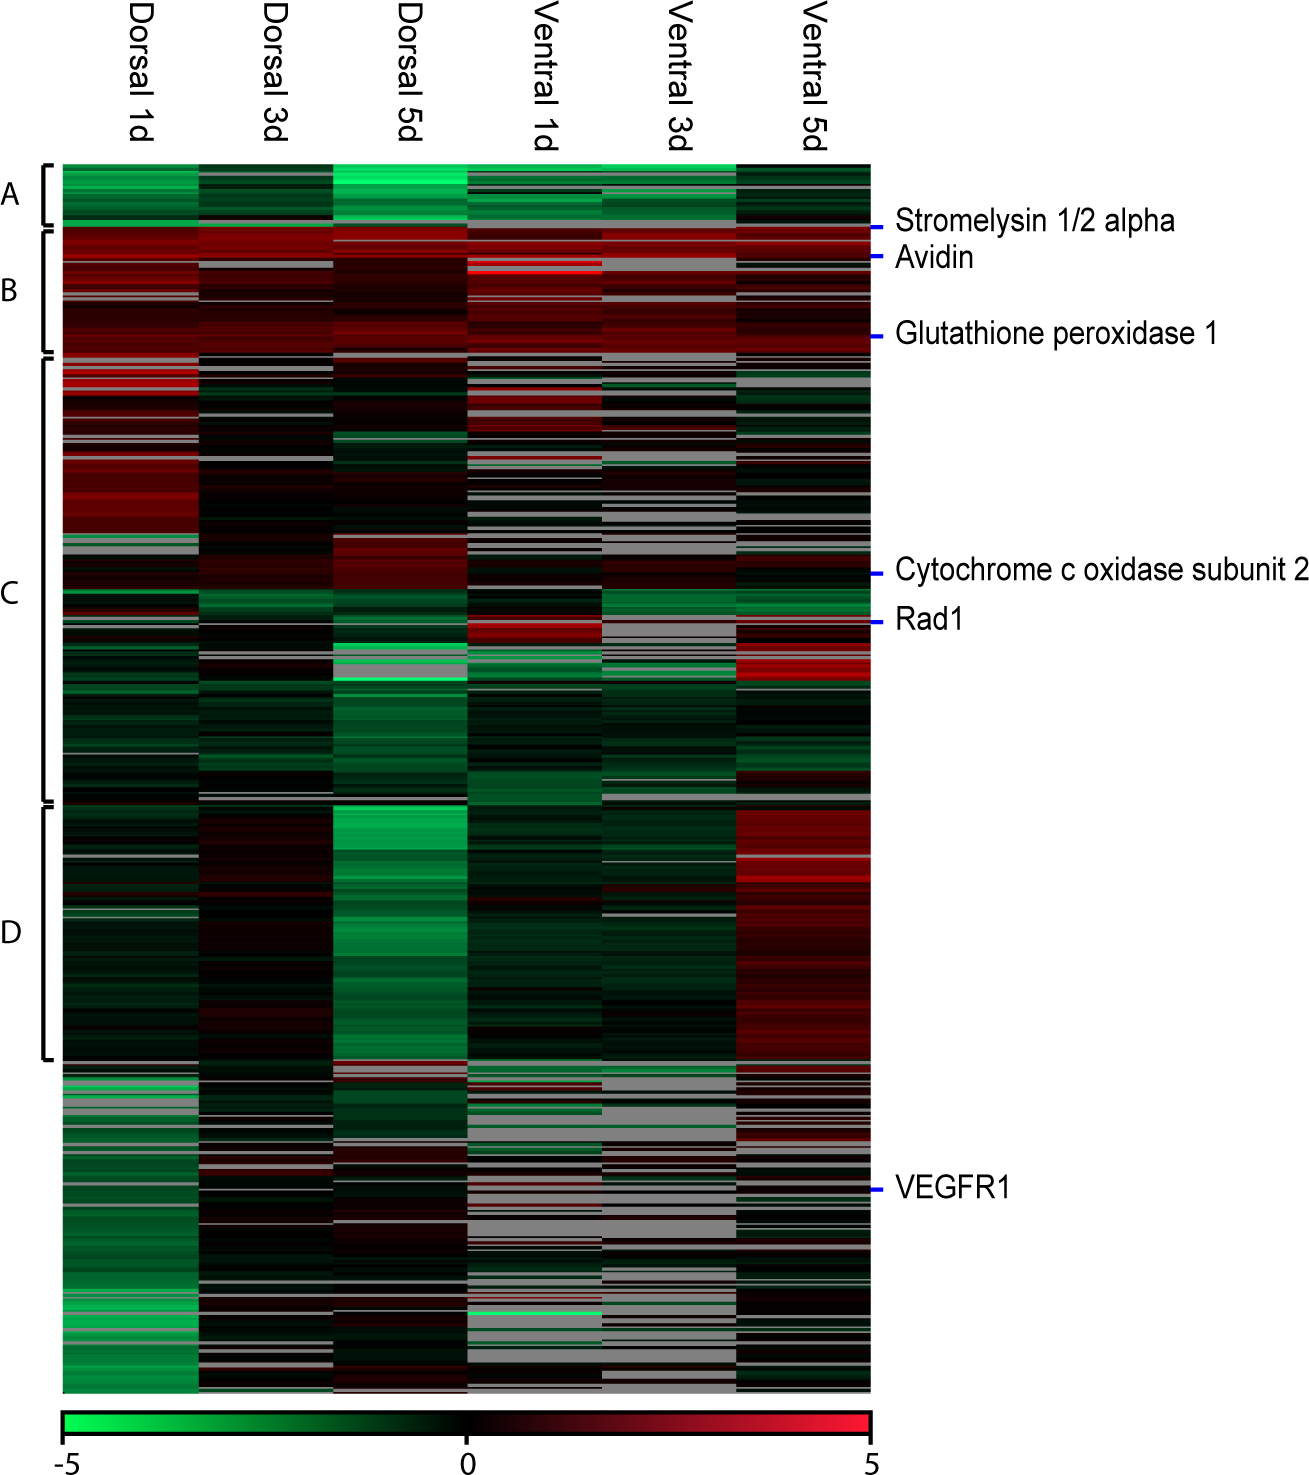
Figure 1. Heat map of expression patterns derived from the microarrays. The heat map is subdivided into four clusters depending on the
expression patterns. The location of the genes used for "quantitative real-time (qRT)-PCR analysis is shown on the heat map.
Only contigs with a minimum number of two valid values have been selected for the heat map. For the heat map, we took 467
candidates into account, but this number was reduced to 465 candidates by filtering for valid values. Within the clusters,
we had 23 transcripts within cluster A, 48 transcripts within Cluster B, 171 transcripts within Cluster C, and 94 transcripts
within Cluster D.

 Figure 1 of
Sousounis, Mol Vis 2013; 19:135-145.
  Figure 1 of
Sousounis, Mol Vis 2013; 19:135-145.