Figure 3. Time-lapse images of porcine trabecular meshwork (PTM) cells treated with 600 μM H2O2. Time-lapse sequence of PTM cells after treatment with 600 μM H2O2 were recorded every 15 min. The figure with “0 hour” (left upper) shows PTM cells immediately after H2O2 treatment. Arrow indicates an affected cell in the sequence. Scale bar represents 50 μm.
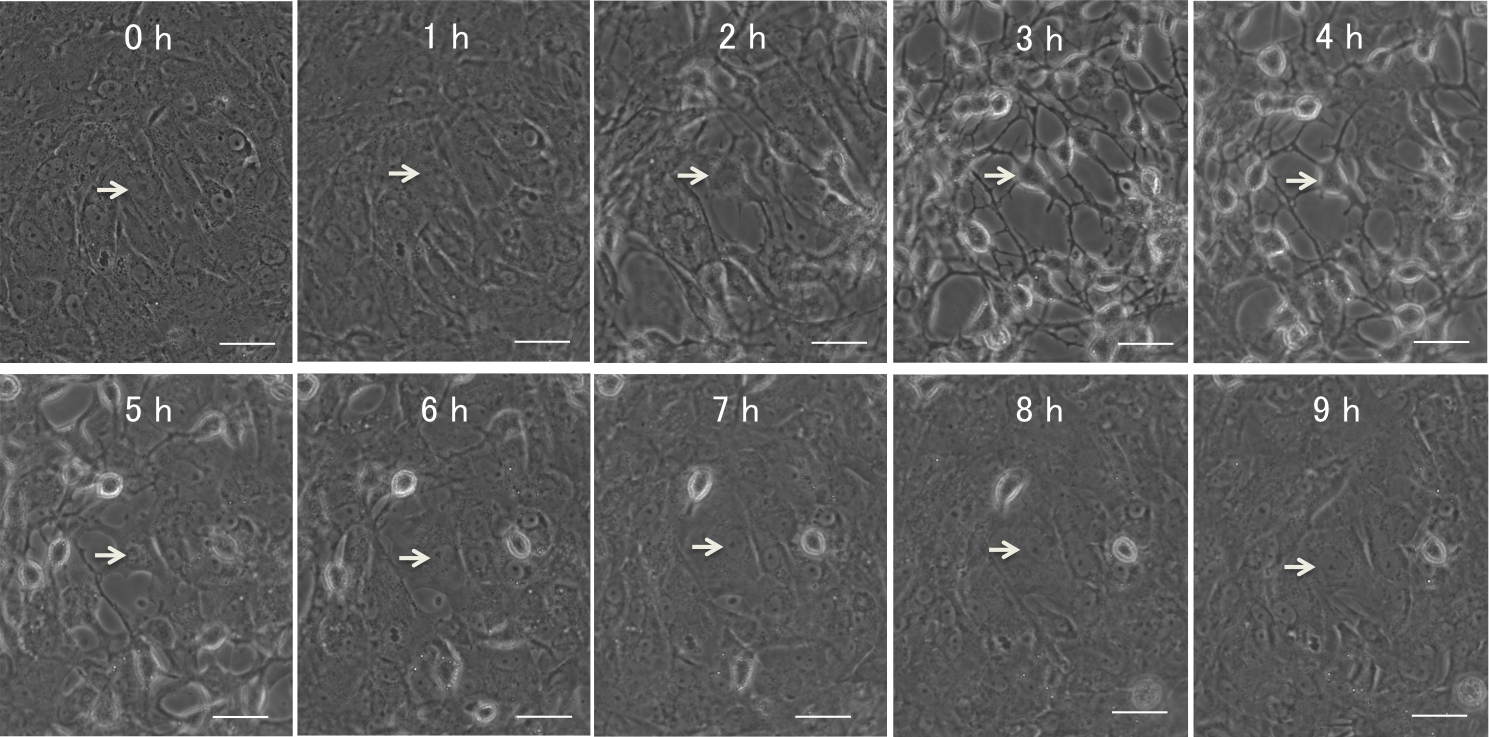
 Figure 3 of
Awai-Kasaoka, Mol Vis 2013; 19:1332-1340.
Figure 3 of
Awai-Kasaoka, Mol Vis 2013; 19:1332-1340.