Figure 6. Heat map of expression values for genes (n=297) that were differentially expressed between hTF and a metagroup comprised of
both hSF and hCF with a p value cutoff (Benjamin-Hochberg-corrected) of 0.05. Rows (genes) are scaled, i.e., the value (z
score) for a given gene in a given sample represents its deviation from the mean expression value of the gene across all samples
in terms of its standard variation, with red denoting upregulation, green downregulation. The dendrograms that determine the
ordering of the rows (genes, left side) and columns (samples, upper side) are computed by hierarchical clustering using Pearson’s
correlation as the distance measure and complete linkage as the clustering method.
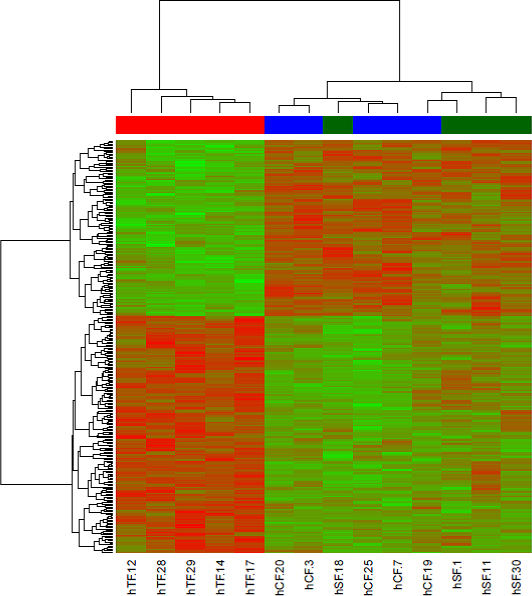
 Figure 6 of
Löbler, Mol Vis 2013; 19:1321-1331.
Figure 6 of
Löbler, Mol Vis 2013; 19:1321-1331.