Figure 5. Cell type-specific mRNA abundance: The Venn diagram shows the number of genes overexpressed in each cell type in comparison
to the other two. The numbers of genes overexpressed in two cell types are indicated in the intersections. The cell types
are fibroblasts from the choroidea (hCF), sclera (hSF) and Tenon’s space (hTF).
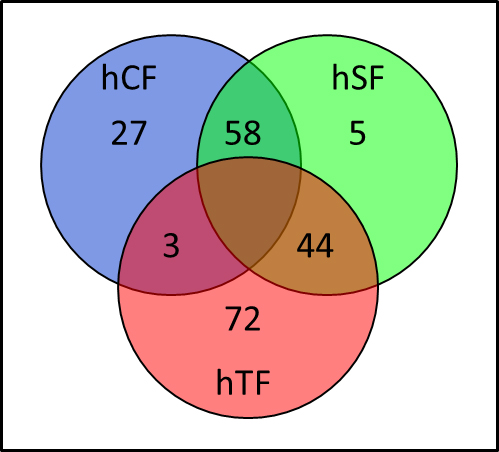
 Figure 5 of
Löbler, Mol Vis 2013; 19:1321-1331.
Figure 5 of
Löbler, Mol Vis 2013; 19:1321-1331.