Figure 4. Principal component analysis: The first two principal components (PC1 and PC2) of the normalized and log-transformed gene
expression data. The sample IDs were used to designate the symbols, choroidea Fibroblast (CF) sample numbers 3, 7, 19, 25
are shown in blue, sclera fibroblast sample numbers 1, 11, 18, 30 are shown in green, and Tenon fibroblast (TF) sample numbers
12, 14, 17, 28, 29 are shown in red.
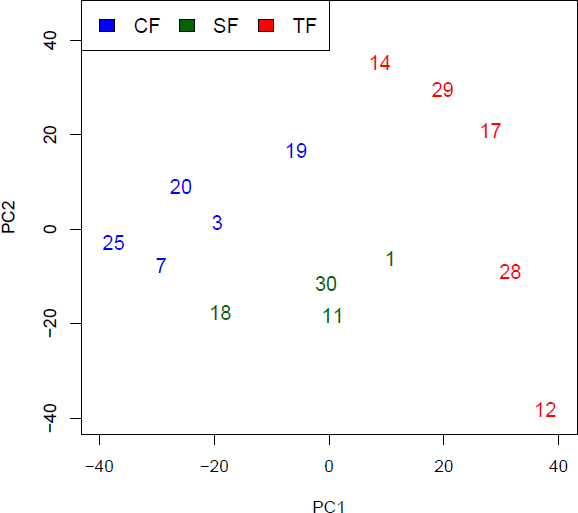
 Figure 4 of
Löbler, Mol Vis 2013; 19:1321-1331.
Figure 4 of
Löbler, Mol Vis 2013; 19:1321-1331.