Figure 2. Extracellular matrix (ECM) gene expression. Comparison of the expression of distinct extracellular matrix genes in the three
fibroblast populations from the choroidea (hCF), sclera (hSF), and Tenon’s space (hTF). Genes encoding fibronectin (FN1), collagen alpha-2(I) chain (Col1A2), collagen alpha-1(III) chain (Col3A1), glia-derived nexin (SERPINE2), matrix metalloproteinase-2 (MMP2), collagen alpha-1(VI) chain (Col6A1) show an expression level well above average (corresponding to a signal intensity of 134). Vertical bars indicate standard
error of the mean (SEM).
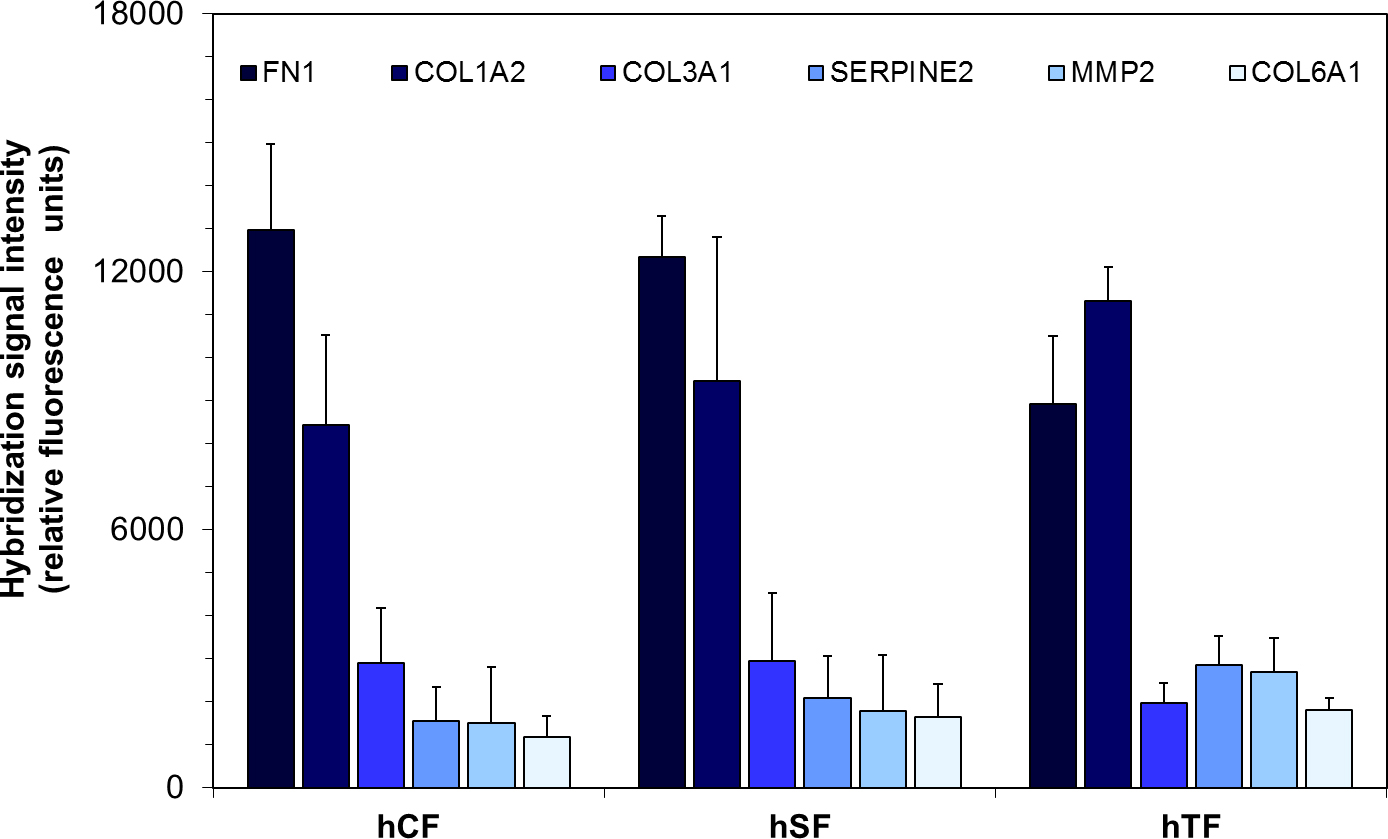
 Figure 2 of
Löbler, Mol Vis 2013; 19:1321-1331.
Figure 2 of
Löbler, Mol Vis 2013; 19:1321-1331.