Figure 5. tdTomato-expressing pattern in the Chx10-cre transgenic mouse line. A–C: In a retinal vertical section, the expression pattern of tdTomato fluorescence (A) is compared with that of GFP-cre. The GFP was enhanced with an antibody to GFP. The overlay of A and B is shown in C. D–F: In the same retinal vertical section, the expression pattern of PKC (D), which labels rod bipolar cells, is compared with that of GFP and tdTomato. The overlay of PKC and GFP labeling is shown
in E. The triple overlay of PKC, GFP, and tdTomato labeling is shown in F. Scale bars represent 25 µm.
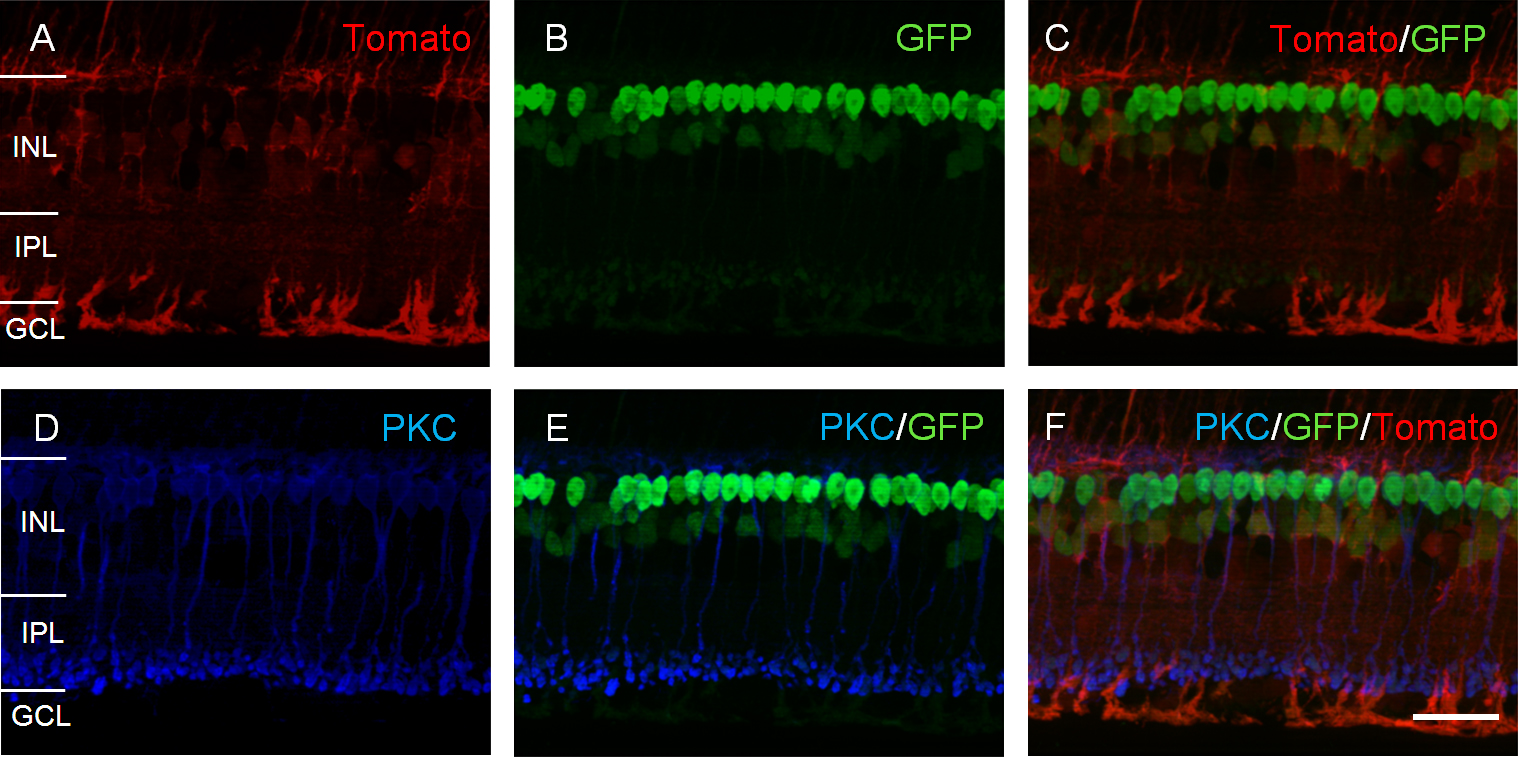
 Figure 5 of
Lu, Mol Vis 2013; 19:1310-1320.
Figure 5 of
Lu, Mol Vis 2013; 19:1310-1320.