Figure 4. Ethyl pyruvate toxicity by pretreatment only. The numbers of cells that remained alive at each experimental time point are
expressed as a percent of cells that were alive at 0 h (left panel) and cumulative cell death at each time point is expressed
as percent increase in dead cells compared to 0 h samples (right panel). Live and dead cell numbers were determined with calcien
AM and ethidium homodimer staining, respectively. Samples that received only pretreatment with ethyl pyruvate (EP) showed
no increase in cell survival and minimal decrease in cell death, compared to control samples. The asterisk indicates a statistically
significant difference in the mean from the 0 mM EP samples at that time point (p<0.05). Means ± standard deviations for n=3
samples are plotted.
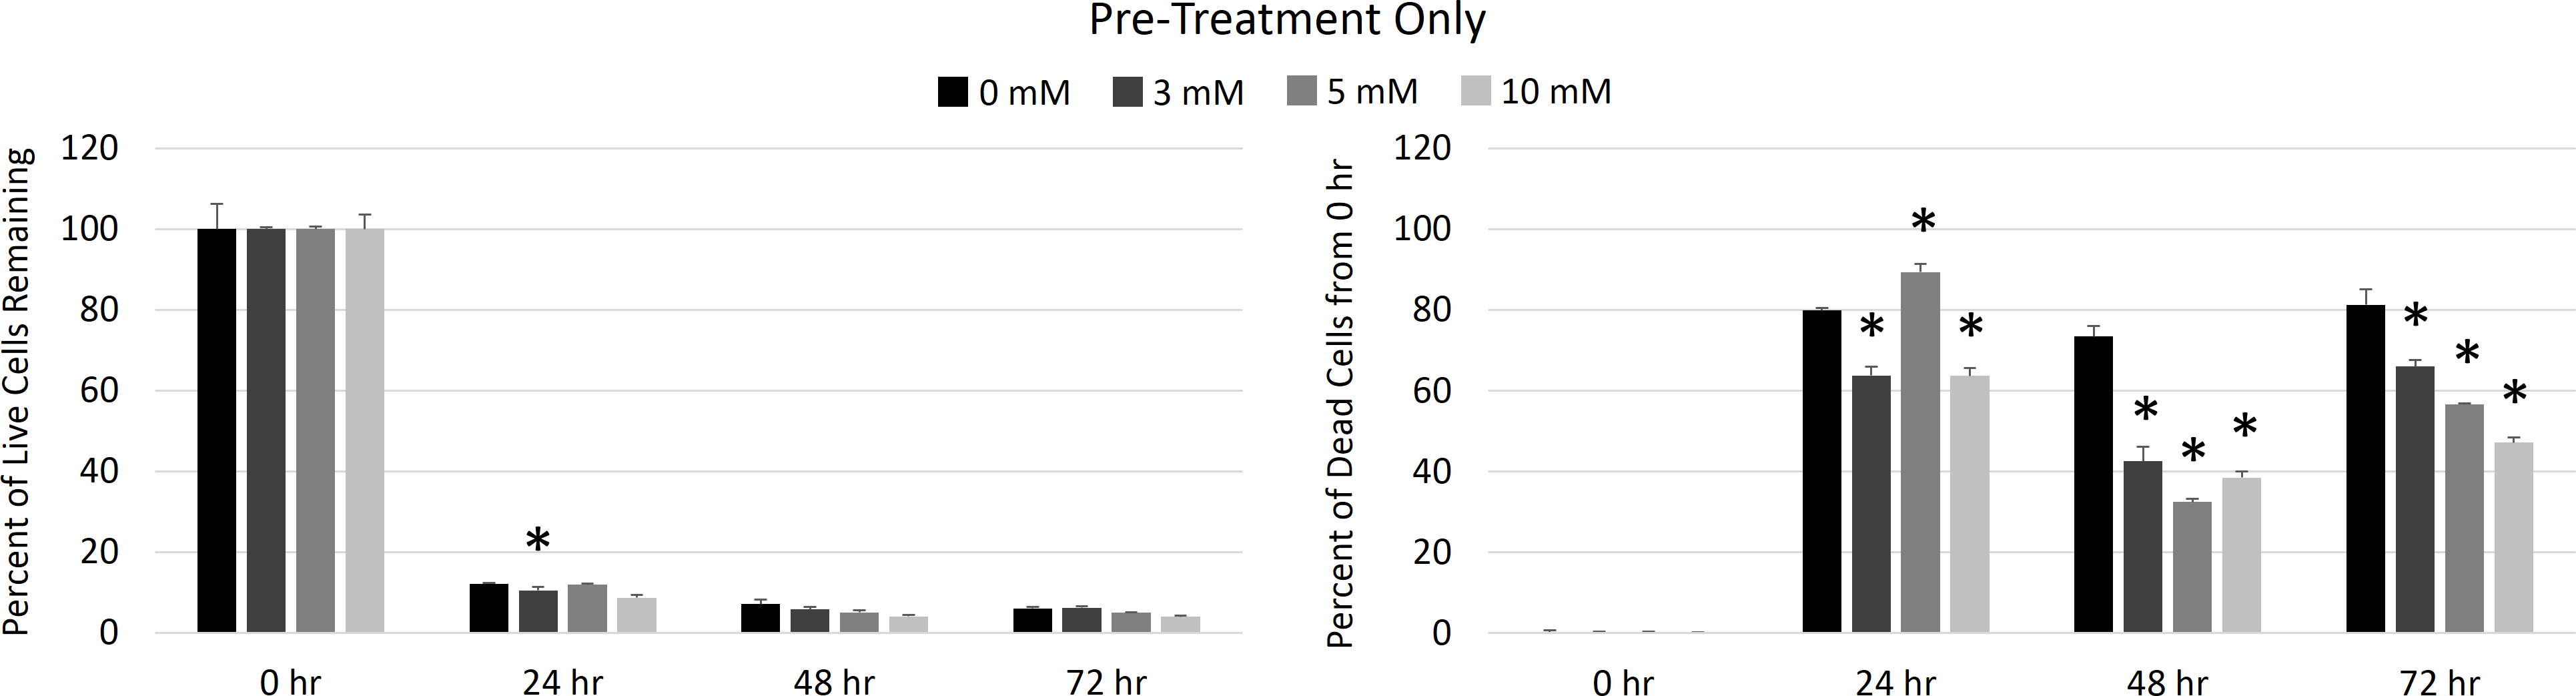
 Figure 4 of
Famili, Mol Vis 2013; 19:1304-1309.
Figure 4 of
Famili, Mol Vis 2013; 19:1304-1309.