Figure 3. Ethyl pyruvate toxicity by pretreatment and cotreatment. The numbers of cells that remained alive at each experimental time
point are expressed as a percent of cells that were alive at 0 h (left panel) and cumulative cell death at each time point
is expressed as percent increase in dead cells compared to 0 h samples (right panel). Live and dead cell numbers were determined
with calcien AM and ethidium homodimer staining, respectively. Samples that received pre- and cotreatment with ethyl pyruvate
(EP) showed markedly increased survival and decreased cell death over control samples. The asterisk indicates a statistically
significant difference in the mean from the 0 mM EP samples at that time point (p<0.05). Means ± standard deviations for n=3
samples are plotted.
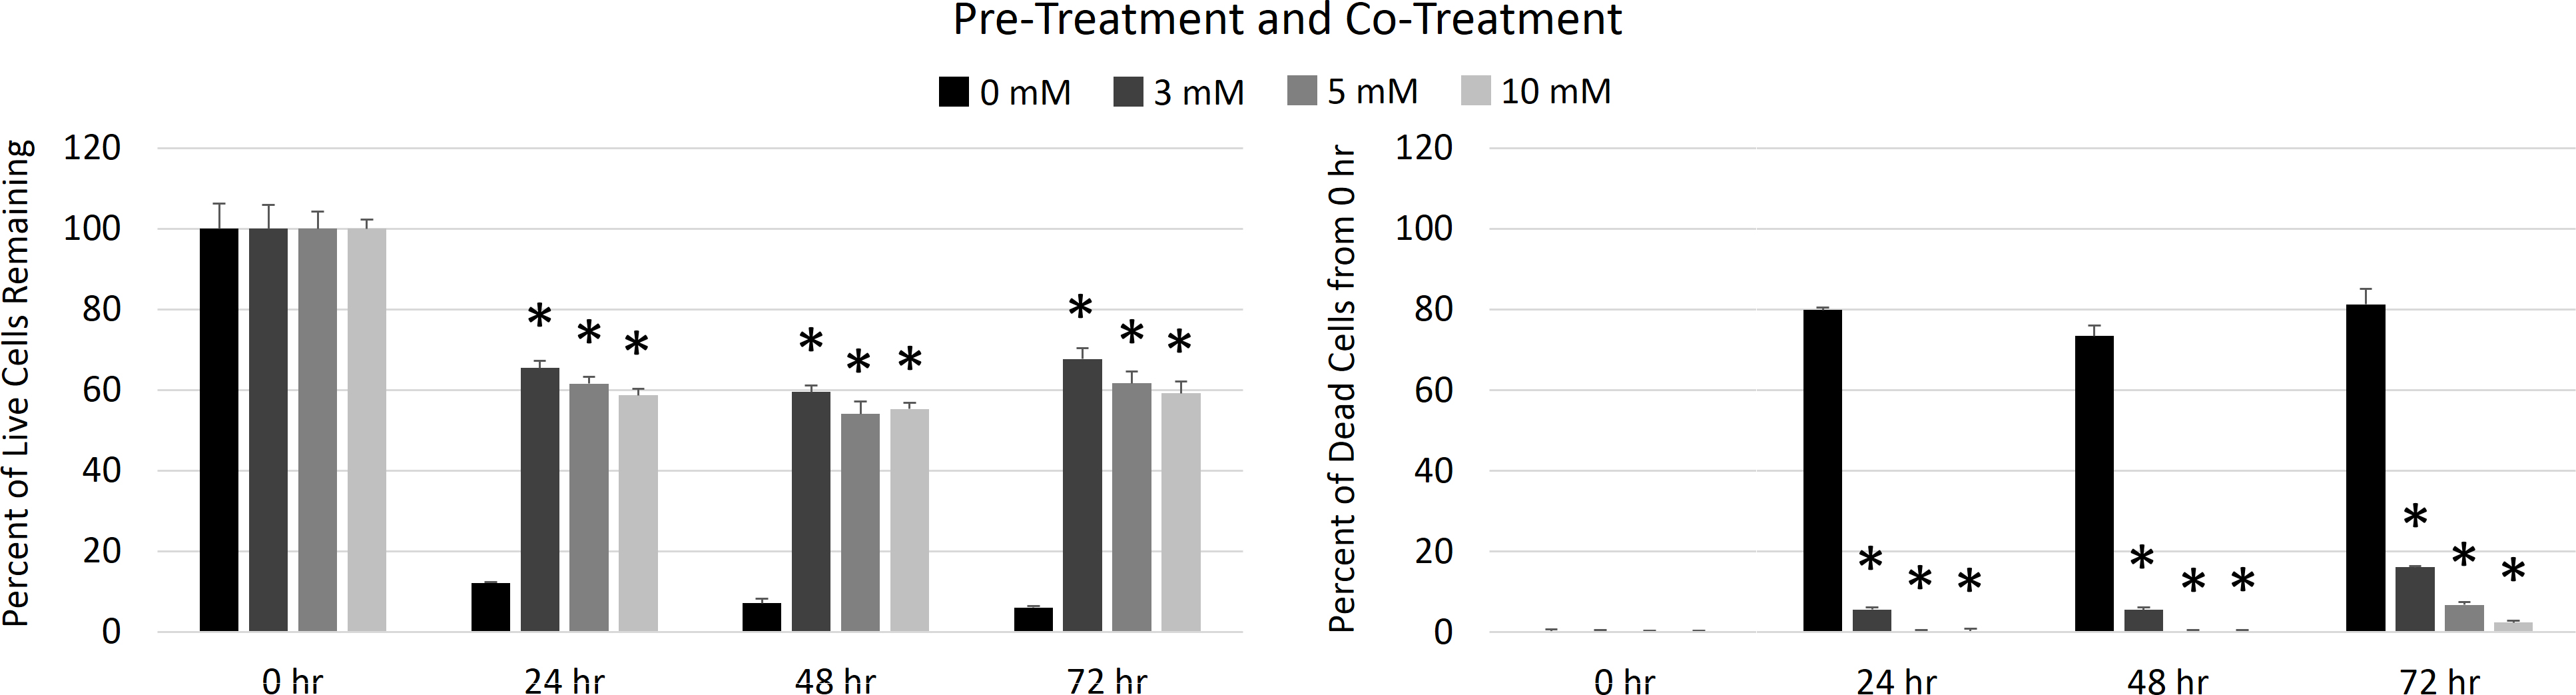
 Figure 3 of
Famili, Mol Vis 2013; 19:1304-1309.
Figure 3 of
Famili, Mol Vis 2013; 19:1304-1309.