Figure 3. Correlation between death to preservation time and RNA quality in the cornea. A: Capillary electropherograms of corneal RNA and corresponding RNA integrity number (RIN) values at varying death to preservation
(DP) times. B: Correlation between DP time and corneal RIN values assessed with linear regression analysis; p=0.0395; R2=0.269 (n=16).
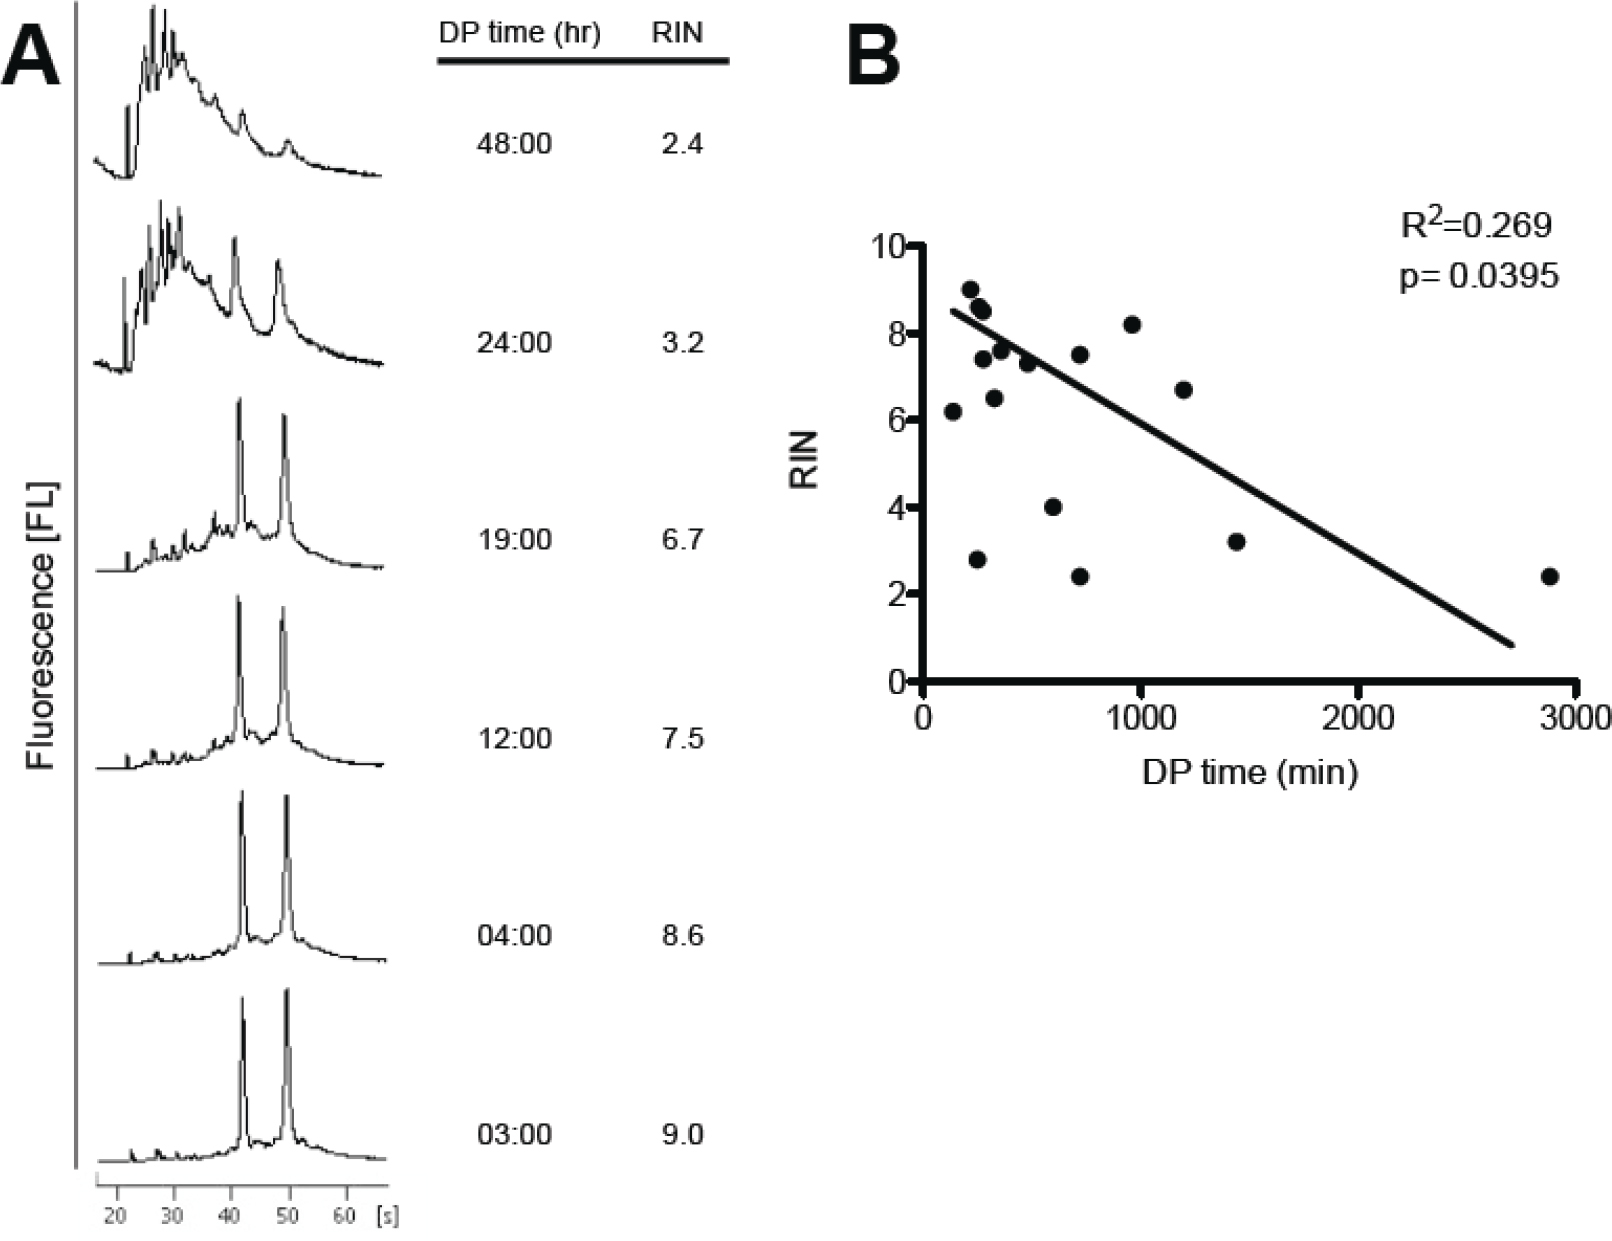
 Figure 3 of
Kim, Mol Vis 2013; 19:1290-1295.
Figure 3 of
Kim, Mol Vis 2013; 19:1290-1295.