Figure 6. Block of CNG channels by L-cis-diltiazem increases viability of cells expressing CNGB3 with disease-associated mutations. A: Representative current traces elicited by 0.1 µM CPT-cGMP in the absence or presence (arrow) of 10 µM L-cis-diltiazem. Current traces were elicited by the voltage protocol described in the Methods section. B: Dose–response relationships for block by L-cis-diltiazem in the presence of 0.1 µM CPT-cGMP for heteromeric CNG channels containing CNGB3-WT (circles), T383fsX (squares),
or F525N (triangles) subunits. Currents were normalized to the current elicited by 0.1 µM CPT-cGMP in the absence of L-cis-diltiazem. Continuous curves represent fits of the dose–response relation with the modified Hill equation described in the
Methods section. Parameters for each channel type were as follows: WT, K1/2,L-cis-dilt.=4.1 µM and h=0.5; for T383fsX, K1/2,L-cis-dilt.=135 µM and h=0.3; and for F525N, K1/2,L-cis-dilt.=4.2 µM and h=0.7. C: Bar graph of the relative cytotoxicity for channel-expressing cells with or without 10 µM L-cis-diltiazem in the presence of 0.1 μM CPT-cGMP treatment (n=12). The dashed line indicates the extent of cell death in vector-only
control cells without treatment. Significant differences were observed between groups indicated by brackets (*, p<0.05); +
indicates significant difference between T383fsX groups treated with or without channel blocker (p<0.01).
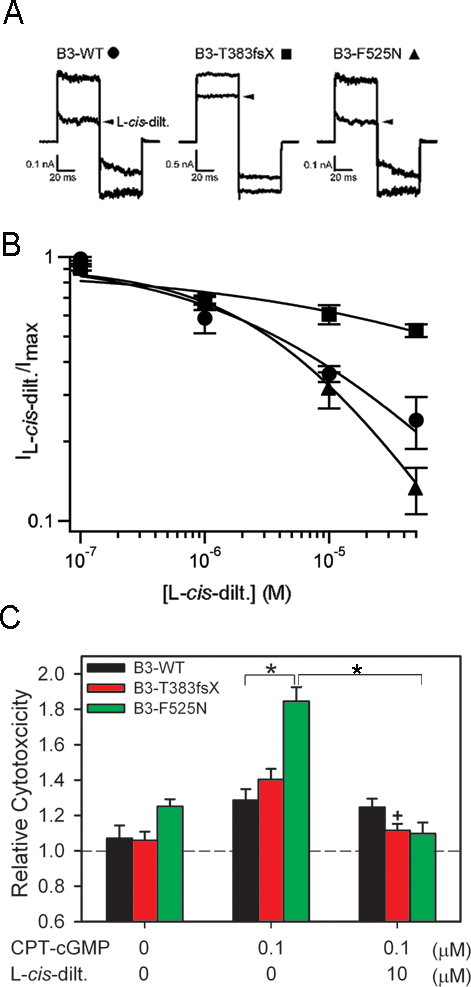
 Figure 6 of
Liu, Mol Vis 2013; 19:1268-1281.
Figure 6 of
Liu, Mol Vis 2013; 19:1268-1281.