Figure 4. CD3 and CD4/CD8 staining of lacrimal gland of affected representative animal. Lymphocytic infiltration hematoxylin/eosin stained
(A) was mostly represented by T cells. B: CD3 positive cells are shown in green (yellow on red nuclear staining background). CD4 positive T cells were abundant and
concentrated in the area of infiltration (C), while CD8 positive cells were less abundant and sparser (D).
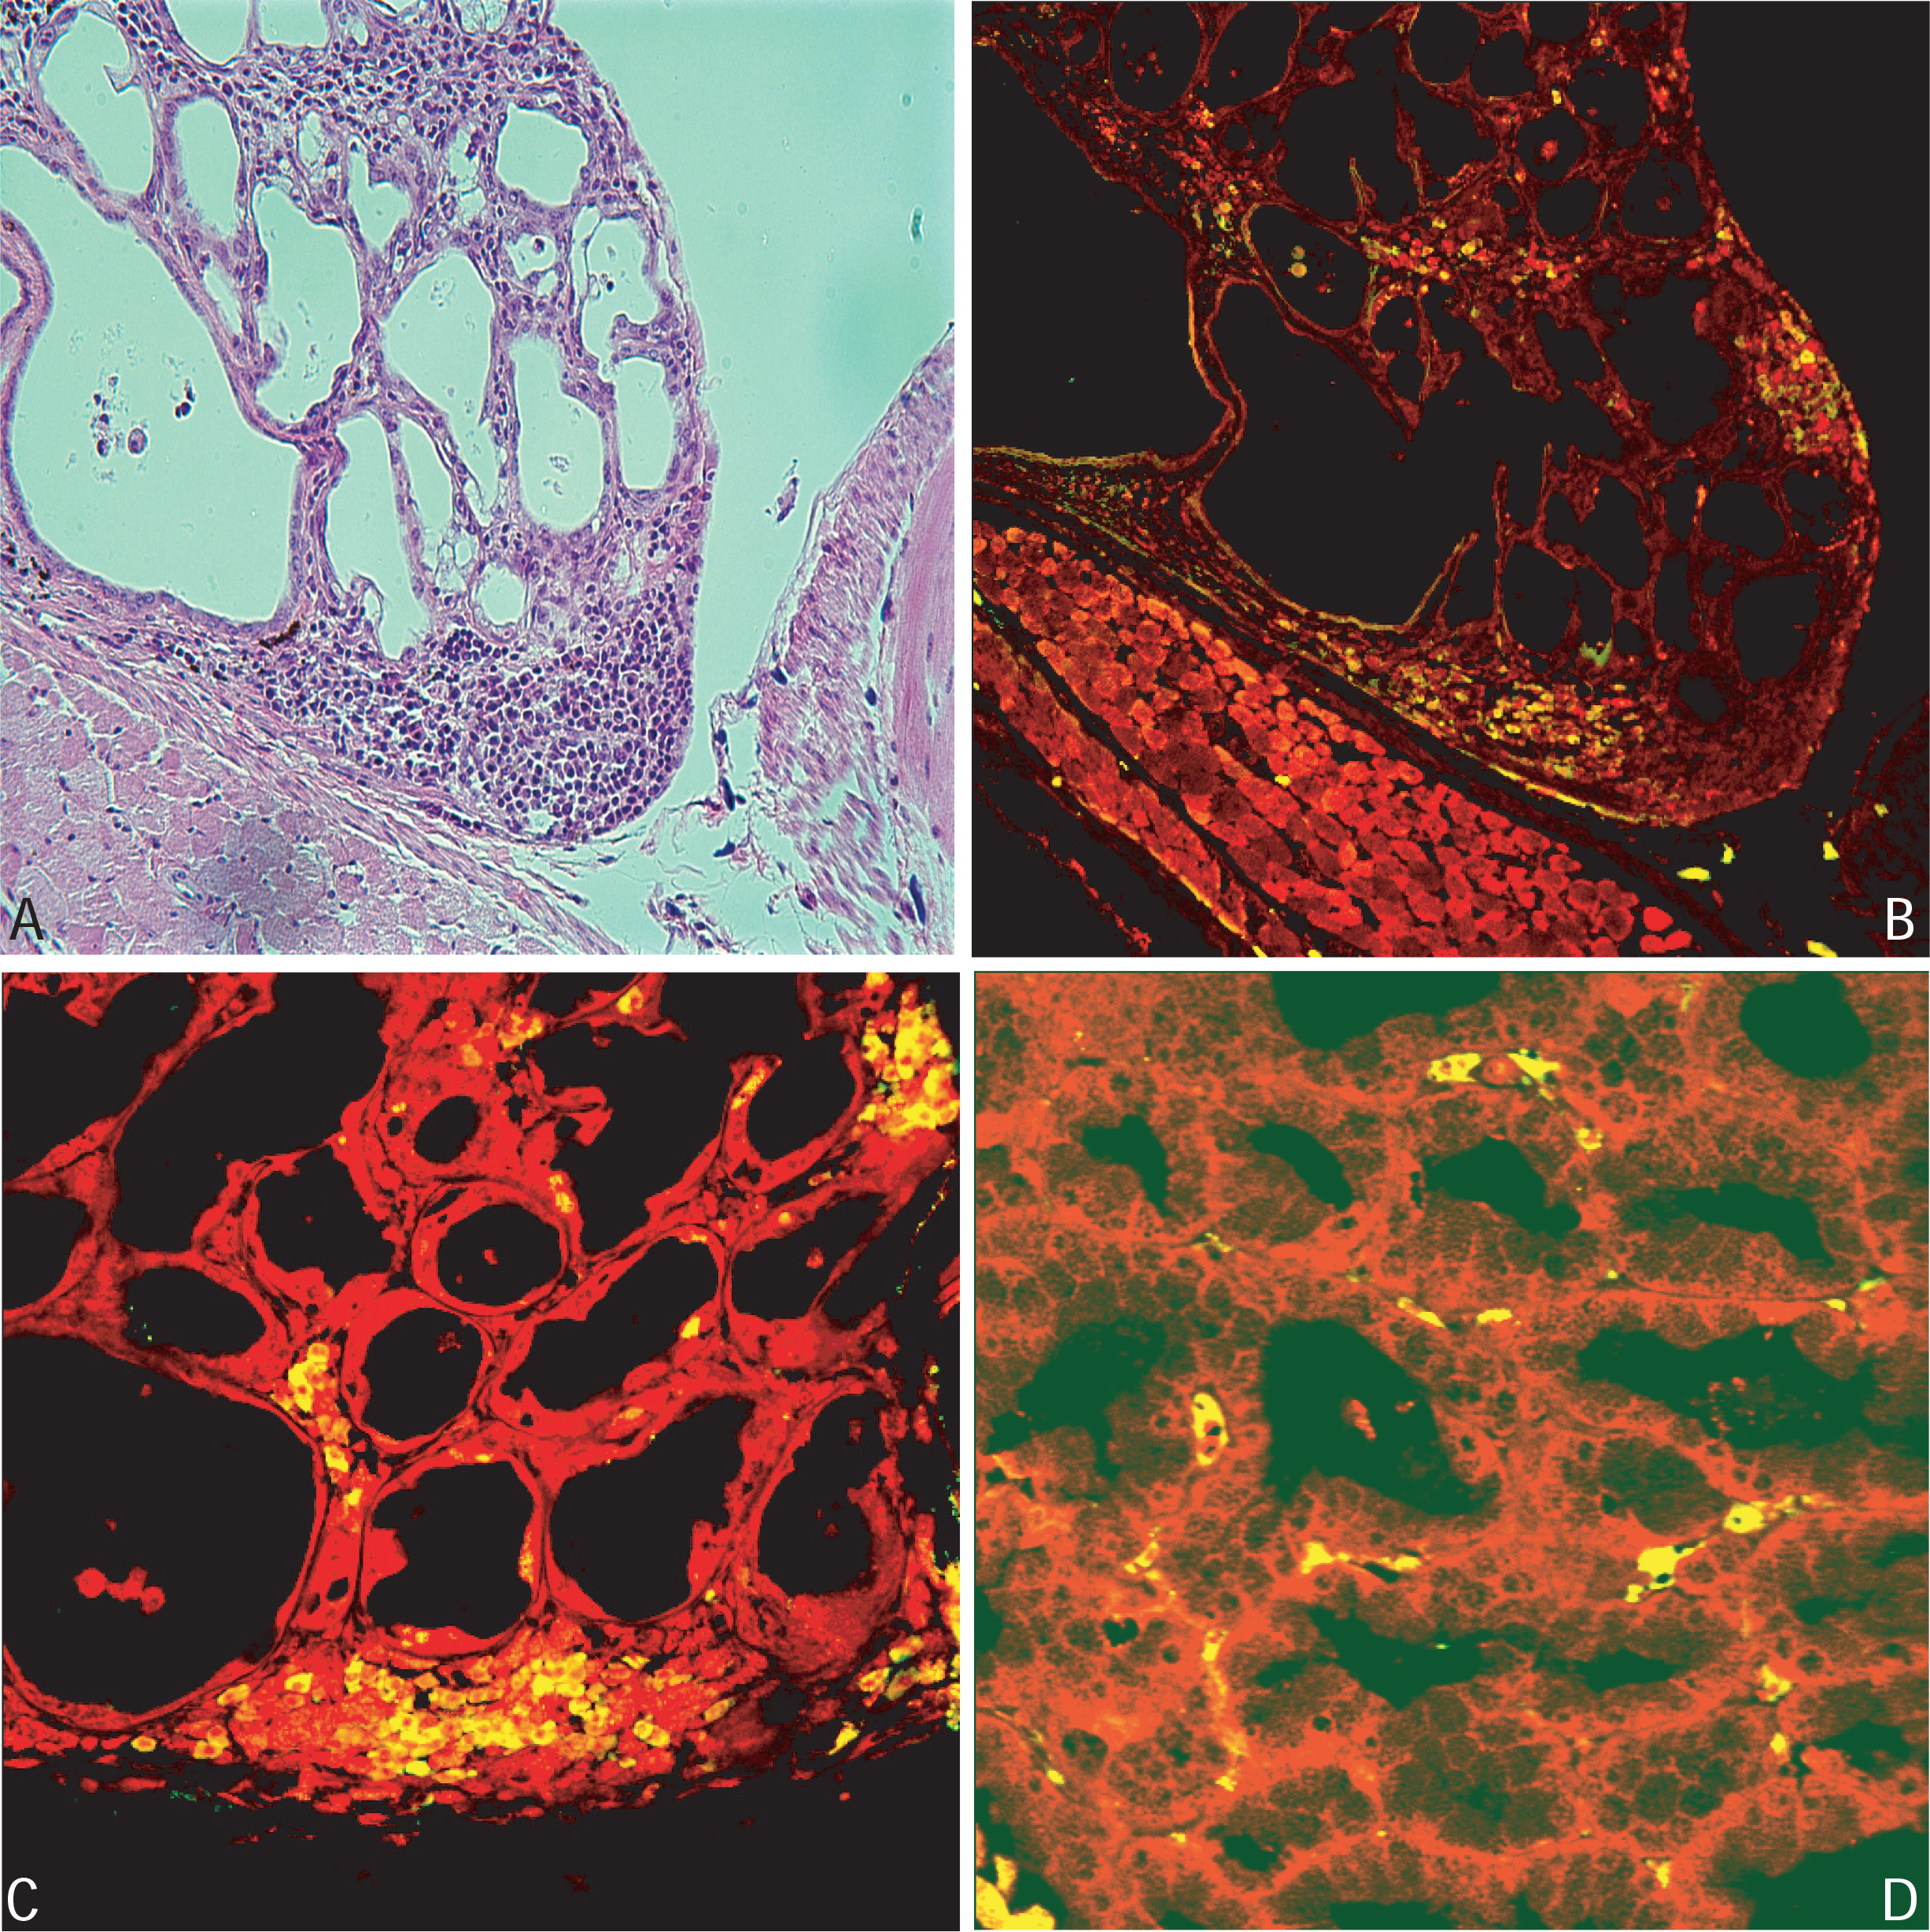
 Figure 4 of
Imam, Mol Vis 2013; 19:1259-1267.
Figure 4 of
Imam, Mol Vis 2013; 19:1259-1267.