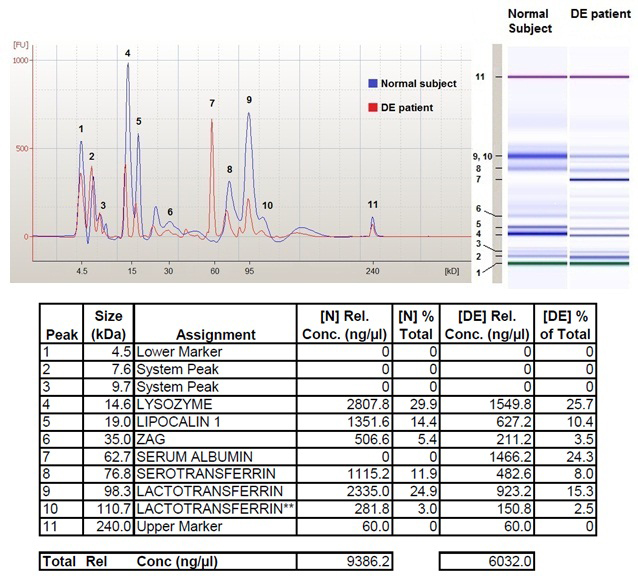
Figure 1. Data from 2100 Bioanalyzer analysis.Upper left: Electropherograms from a representative normal subject (blue line) and a dry
eye (DE) patient (red line) are here aligned and overlapped. Recognized peaks of interest are numbered 1 through 11. Upper
right: The virtual gel images related to both samples are here compared showing different intensity of corresponding bands
between normal subject and DE patient. Bands are here also numbered 1 through 11. Table at the bottom summarizes for each
peak the following parameters: recognized molecular weight in kDa, name of the protein assigned on the basis of the validation
process [
13], concentration of each protein expressed in ng/microliter, percentage of each protein versus total protein content for both
(N) normal subject and (DE) patient. The last line of this table reports total protein concentration expressed in ng/microliter
 Figure 1 of
Versura, Mol Vis 2013; 19:1247-1257.
Figure 1 of
Versura, Mol Vis 2013; 19:1247-1257.