Figure 2 of
Yazar, Mol Vis 2013; 19:1238-1246.
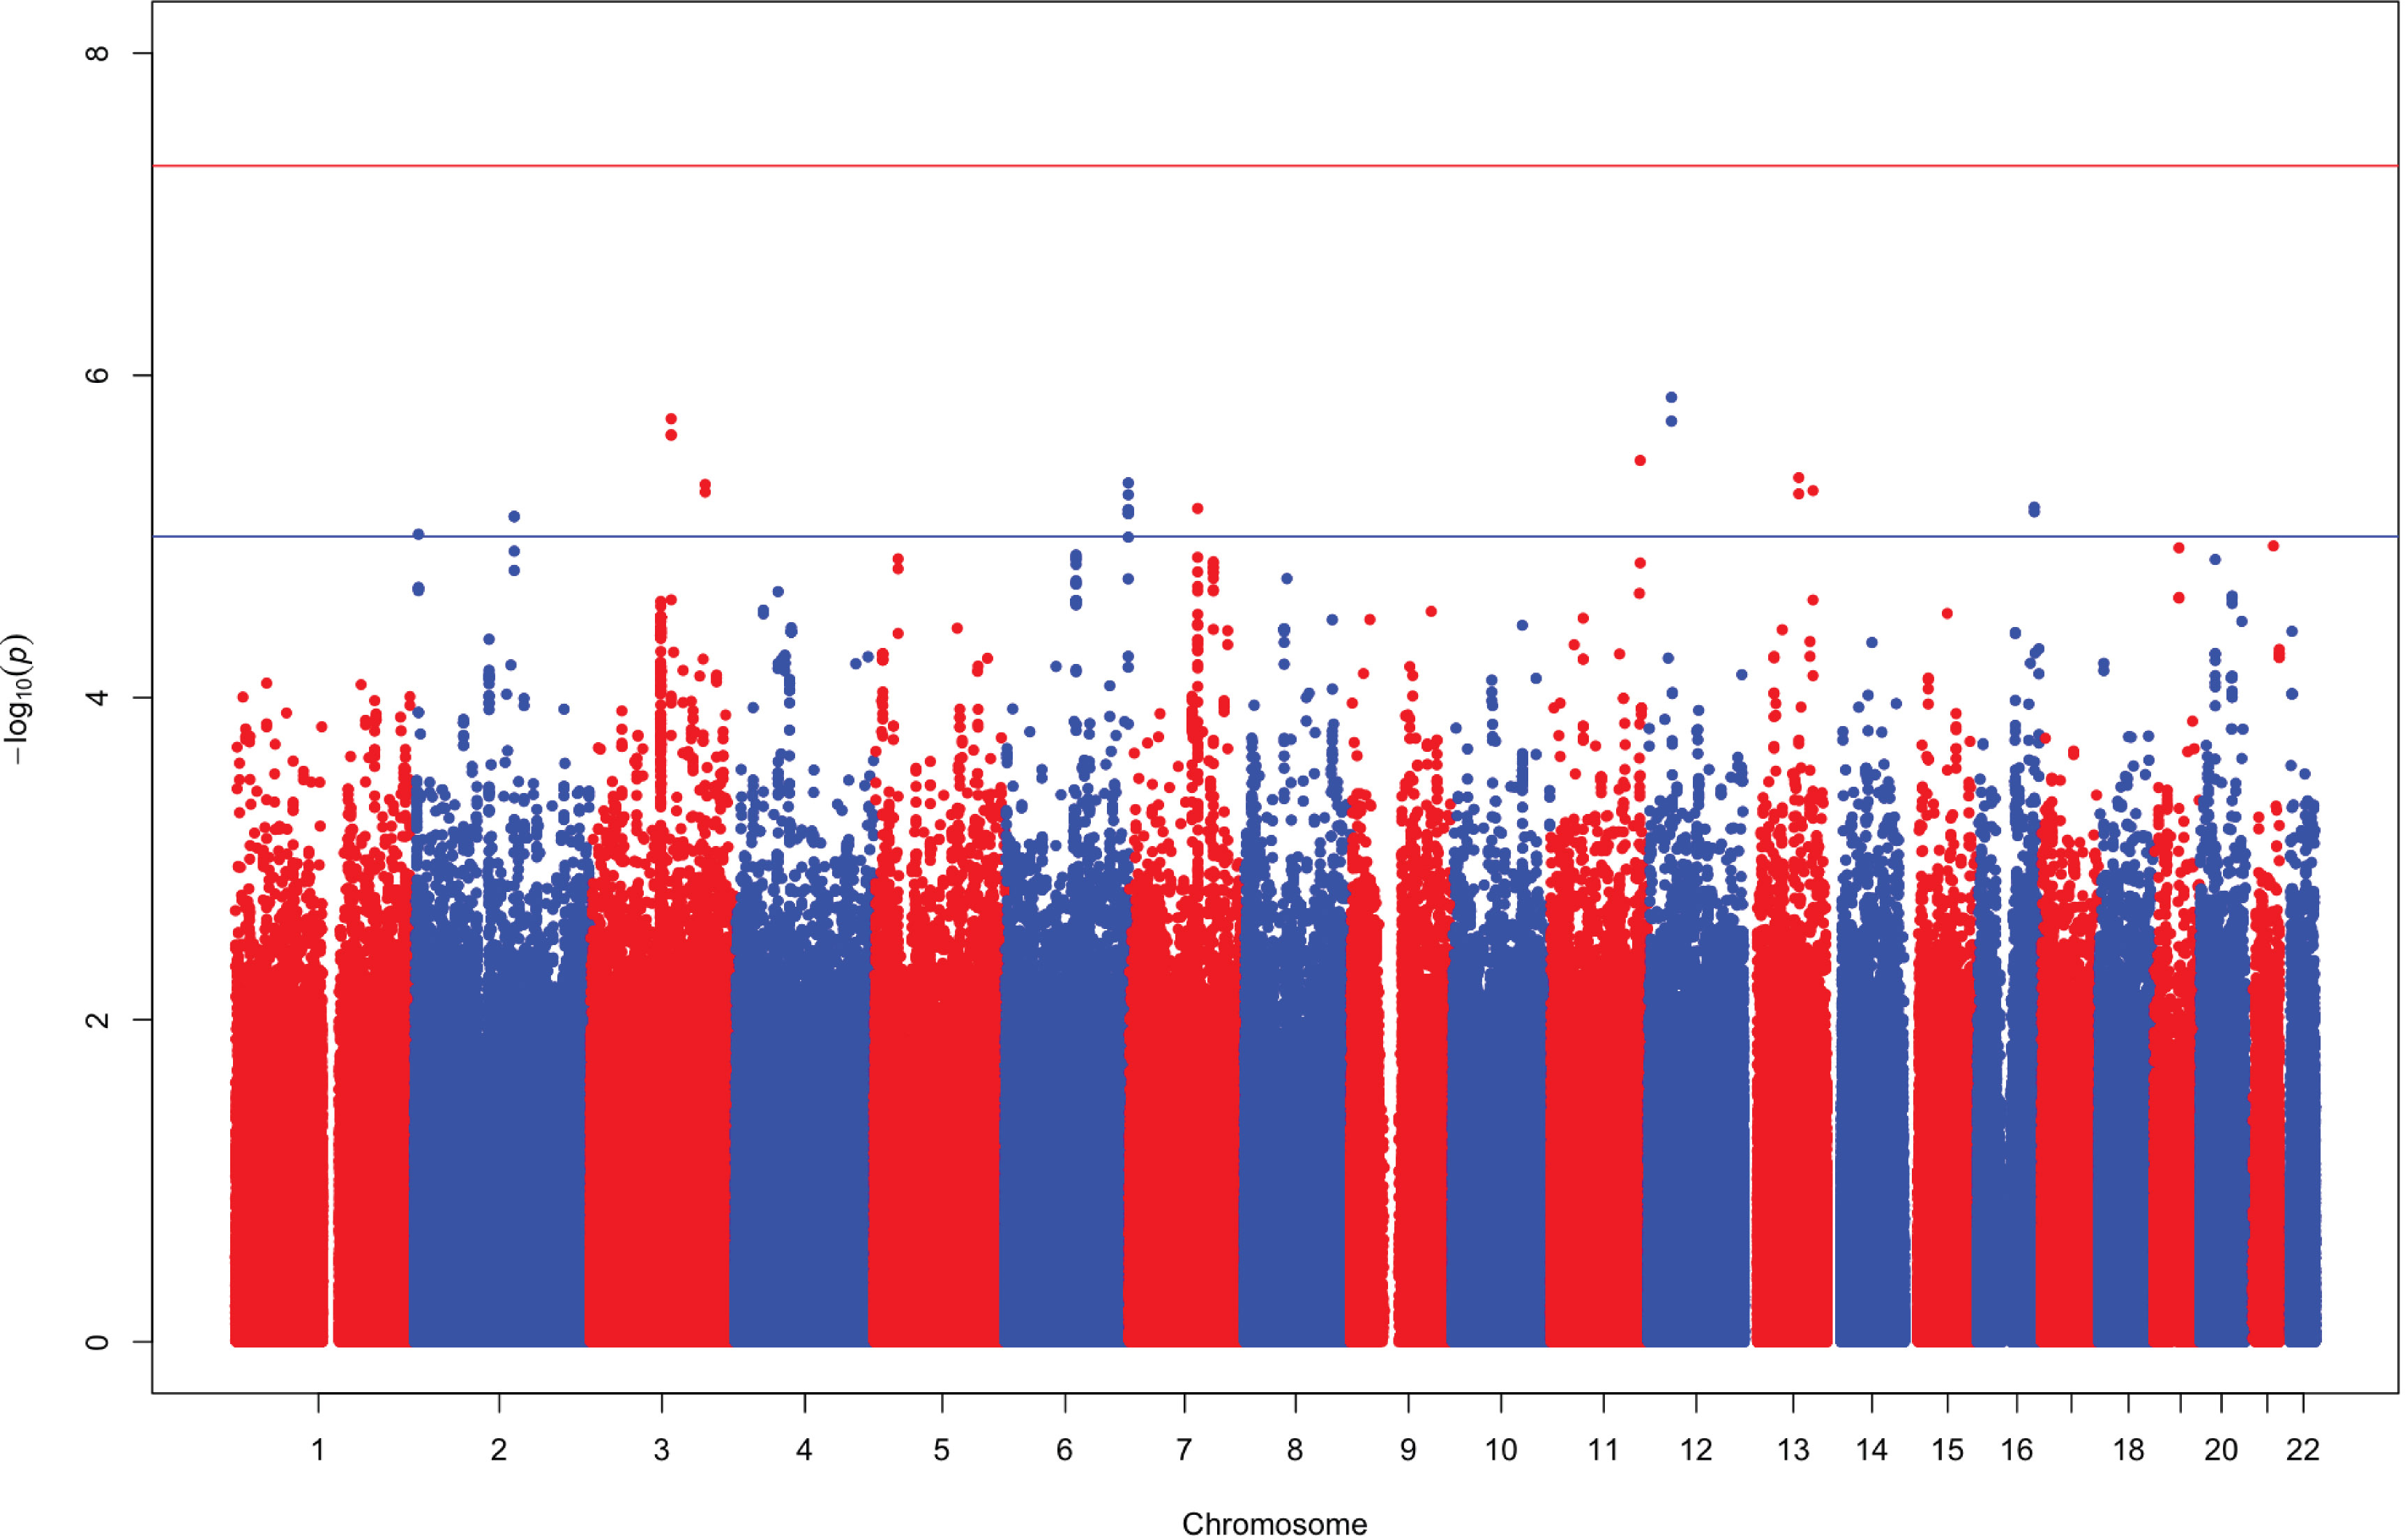
Figure 2.
Manhattan plot of meta-analysis results. The association of single nucleotide polymorphisms and corneal astigmatism (age and sex adjusted) are plotted for each chromosome.
 Figure 2 of
Yazar, Mol Vis 2013; 19:1238-1246.
Figure 2 of
Yazar, Mol Vis 2013; 19:1238-1246.