Figure 1. Ultraviolet–cone opsin localization in wild-type and Rpe65−/− Rho−/− explant cultures. A: In wild-type cultures, the ultraviolet (UV)-opsin proteins are trafficked to the photoreceptor outer segment (OS), whereas
(B) in retinal pigment epithelium-specific protein 65kDa and rhodopsin (Rpe65−/− Rho−/−) explant cultures treated with vehicle, UV-opsin is found throughout the cone photoreceptor, mostly in the axon and synapse,
with a minor amount trafficked correctly to the cone OS. C: Exogenous supplement of 1 μmol 11-cis retinal, or (D) 1 μmol 11-cis retinol to Rpe65−/− Rho−/− explant cultures improved trafficking of UV–cone opsin toward the target site. Trafficking of UV–cone opsin in Rpe65−/− Rho−/− explant cultures did not improve significantly upon treatment with (E) retinoic acid (RA; 500 nmol), (F) retinoic acid receptor (RAR)-agonist (AM80, 1 μmol) or (G) retinoid X-receptor (RXR)-agonist (SR11345, 1 μmol). H: No primary antibody control is provided to document non-specific binding of the secondary antibody. I: UV–cone opsin distribution profiles and quantitative assessment in wild-type and Rpe65−/− Rho−/− explants. Protein distribution profiles were obtained from binarized and thresholded images normalized to a fixed size using
Image J software. The protein intensity distribution was analyzed based on three different cone compartments: OS; inner segment
(IS), cell body and axon; and pedicle. The mean distribution profile is plotted for the UV–cone opsin, for which examples
were shown in (A-H). The data confirmed that UV–cone opsin is trafficked exclusively to the OS in the wild-type explant. In Rpe65−/− Rho−/− explants, ~25% of the cone opsin is localized to the OS. J: Cone opsin trafficking was increased to ~75% after 11 cis-retinal and ~65% after 11-cis retinol treatment. Image acquisition and analysis was performed as in (I). K: Cone opsin trafficking to the outer segments was increased to ~75% after RA treatment, whereas treatment with RAR- or RXR-agonist
had no effect. Please note that none of the comparisons between RAR and RXR were statistically significant and are not identified
as such. Image acquisition and analysis was performed as in (I; n=12–18 per condition; *p<0.05; **p<0.01; ***p<0.005; p>0.05 or n.s. not significant). Scale bar=20 μm.
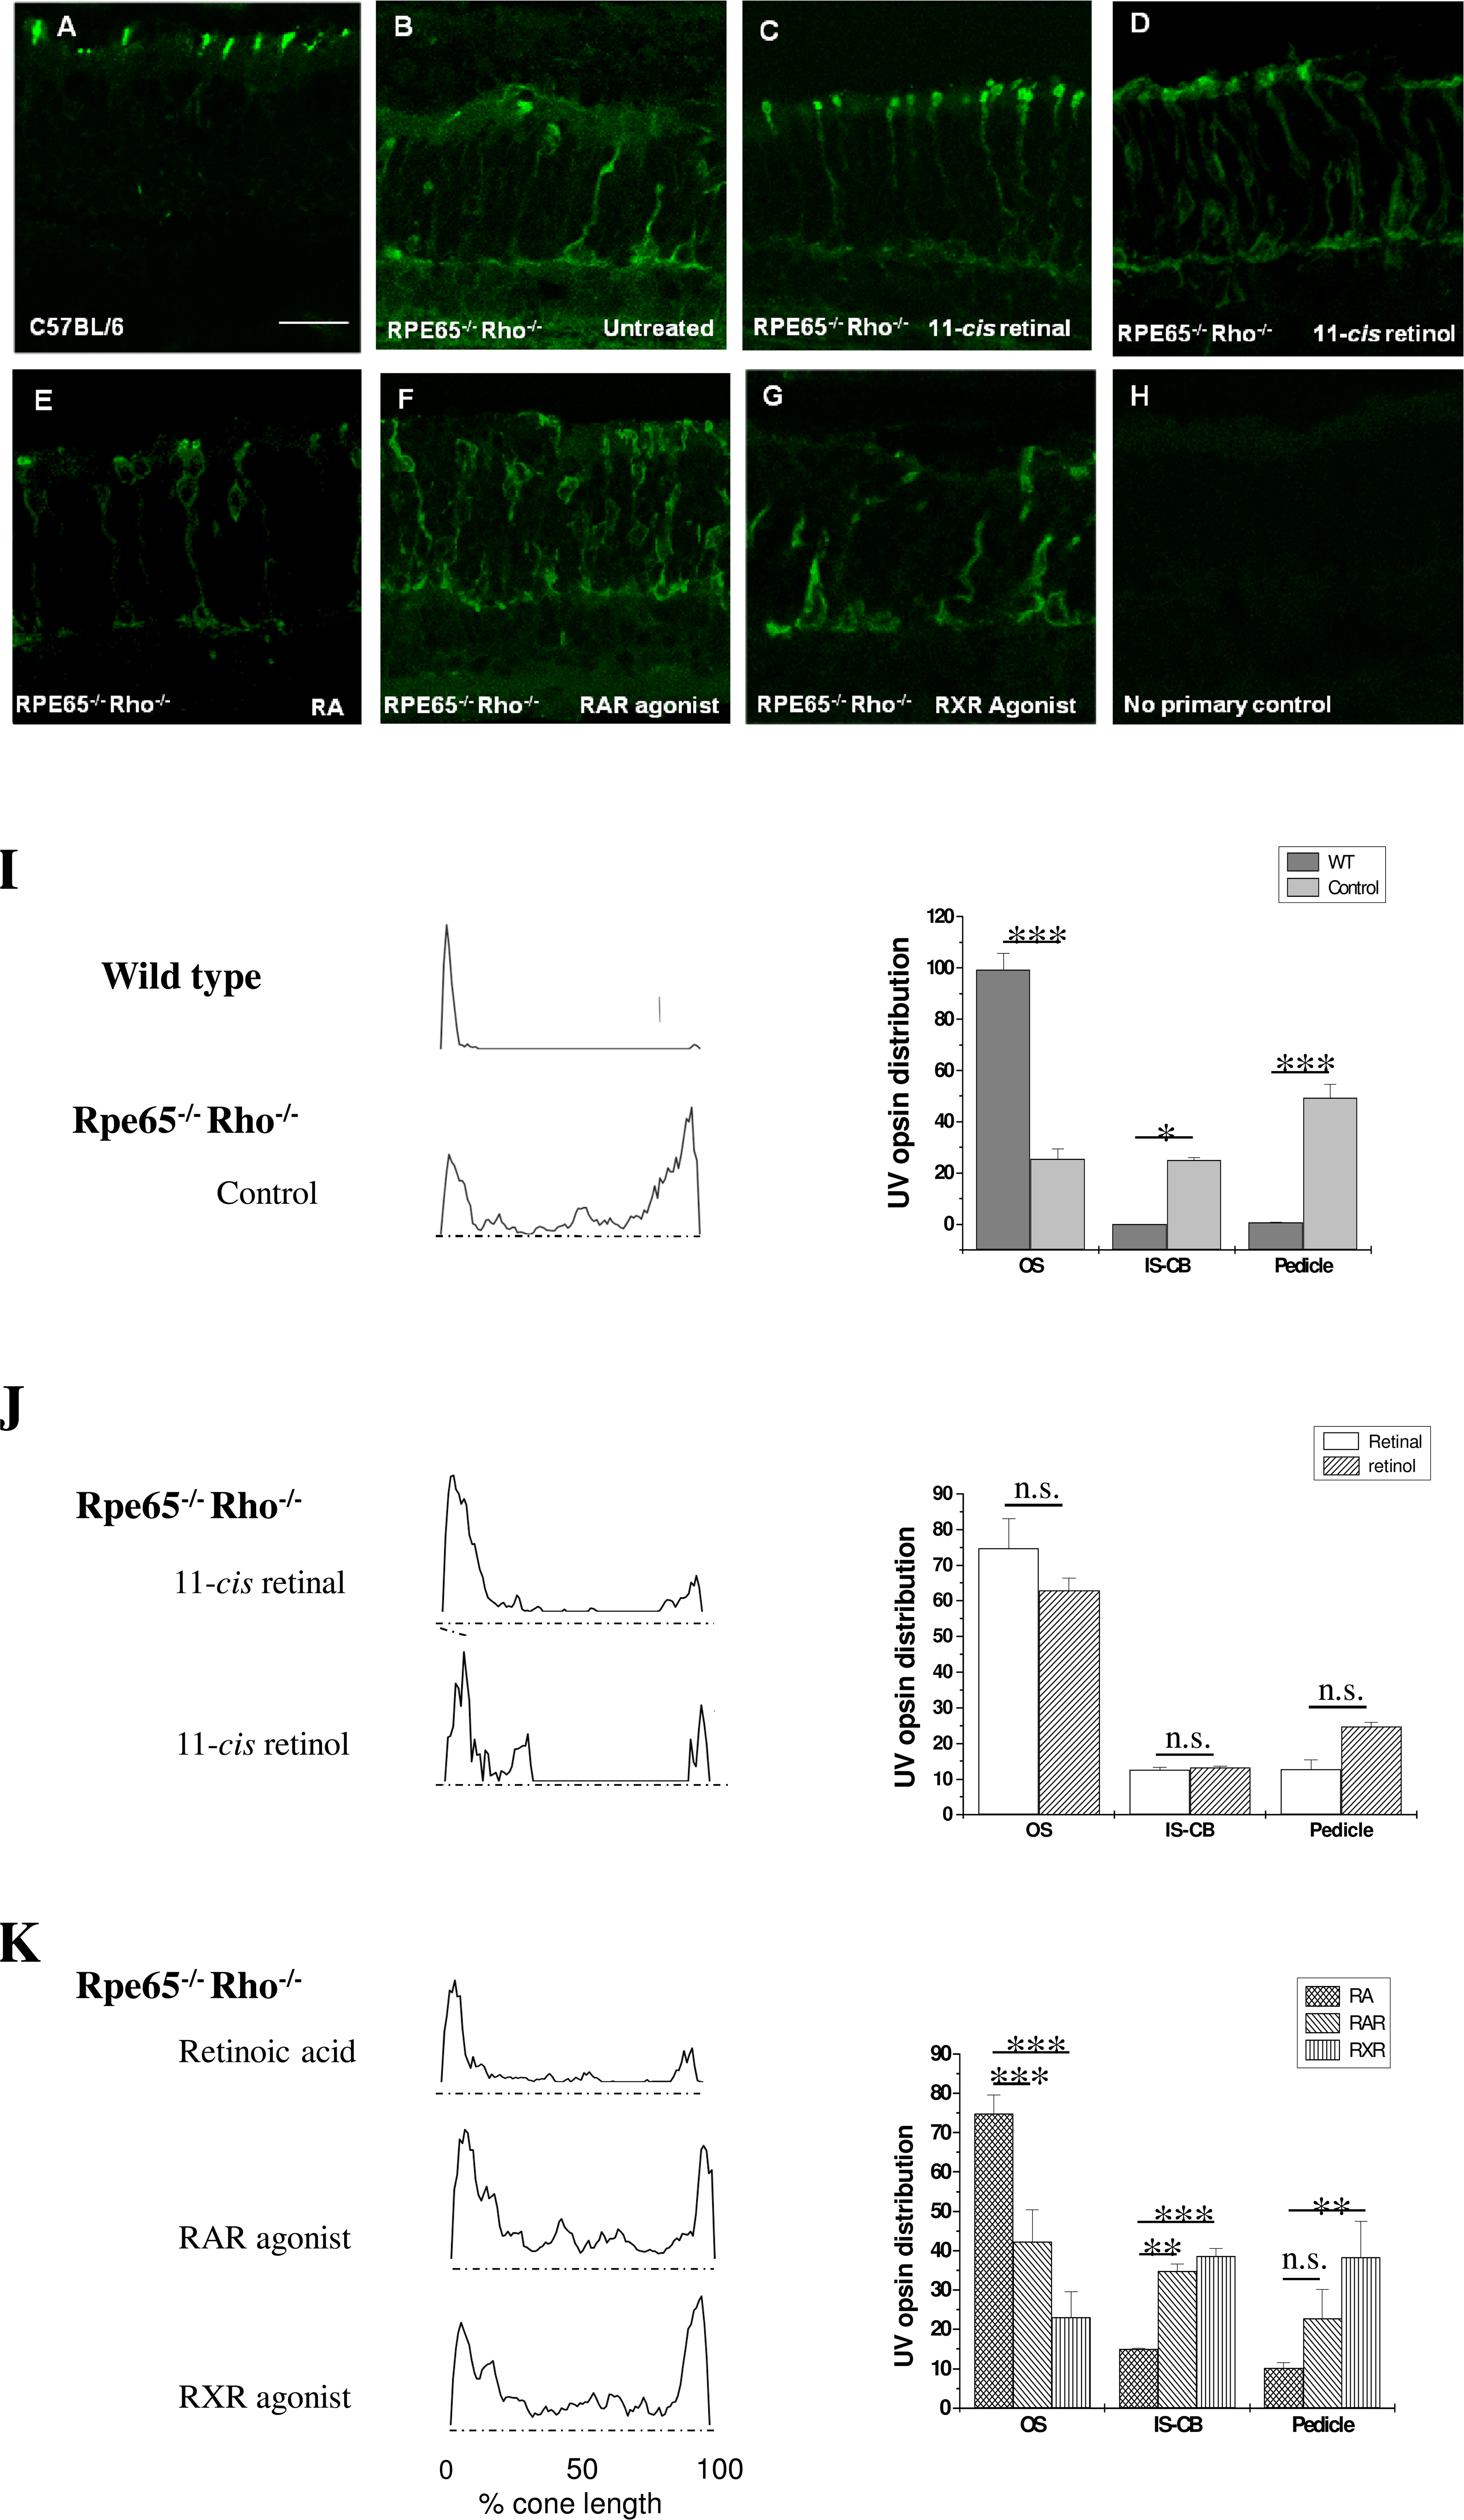
 Figure 1 of
Bandyopadhyay, Mol Vis 2013; 19:1149-1157.
Figure 1 of
Bandyopadhyay, Mol Vis 2013; 19:1149-1157.