Figure 4. Characterization of mouse corneal endothelial cells (MCECs). MCECs in passage 2 were immunostained with the antibodies for
Na+K+ ATPase (A), Zo-1 (B), Isotype-matched IgG1 negative control (C) and visualized by fluorescent microscopy. Scale bar: 50 μm. Reverse transcription PCR was also carried out to see mRNA expression
of Aqp1, Zo-1,Col8a2, Col1a1 in cultured passage 2 MCECs (D) and passage 7 MCECs (E). Size markers are shown in the first lane from the left. Note that the fibroblast marker Col1a1 was not expressed in passage 2 cells but was expressed in passage 7 cells.
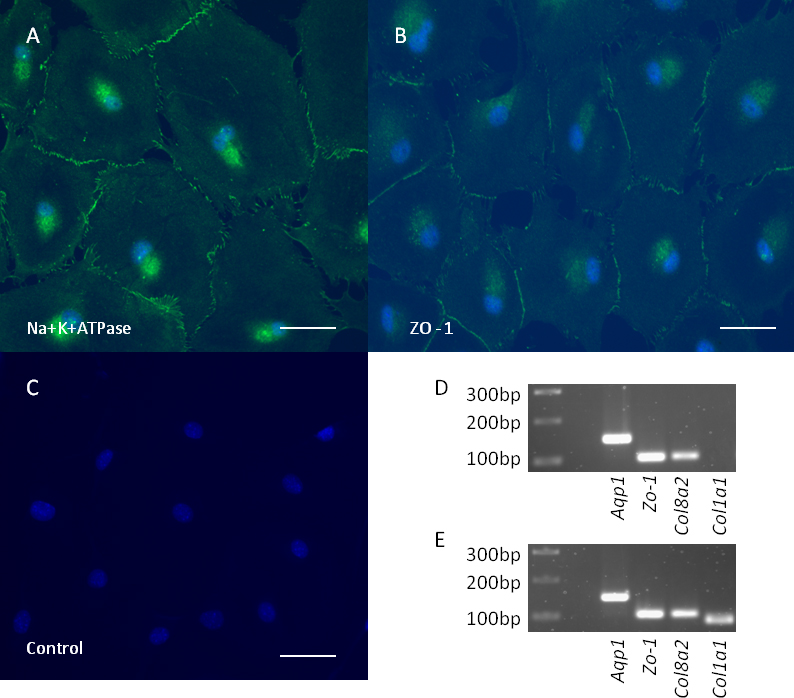
 Figure 4 of
Shei, Mol Vis 2013; 19:1096-1106.
Figure 4 of
Shei, Mol Vis 2013; 19:1096-1106.