Figure 6. Expression profile of core clock gene Bmal1 over a single 24 h period under distinct lighting conditions. A: In a 12 h light: 12 h dark cycle (LD) Bmal1 exhibited a rhythmic expression pattern with the peak value shortly after light onset (n=3-6 per time point). B: Rhythmicity was maintained although dampened in constant dark (DD) (n=6 per time point). C: However constant light (LL), as with the other genes, led to a large phase shift, with maximal values now occurring at CT18
(n=4 per time point). Illumination conditions are depicted as solid white (day) and solid grey (night) areas in LD, right
hatched (subjective day) and solid grey (subjective night) areas in constant dark (DD) and solid white (subjective day) and
left hatched (subjective night) areas in constant light (LL). Animals were killed every 3 or 4 h across the 24 h period, and
RNA extracted from retinal tissue. RNA expression levels were quantified by real time PCR. One-way analysis of variance (ANOVA)
and cosinor levels of significance (PA and Pc respectively) are given in the upper right corner of each panel.
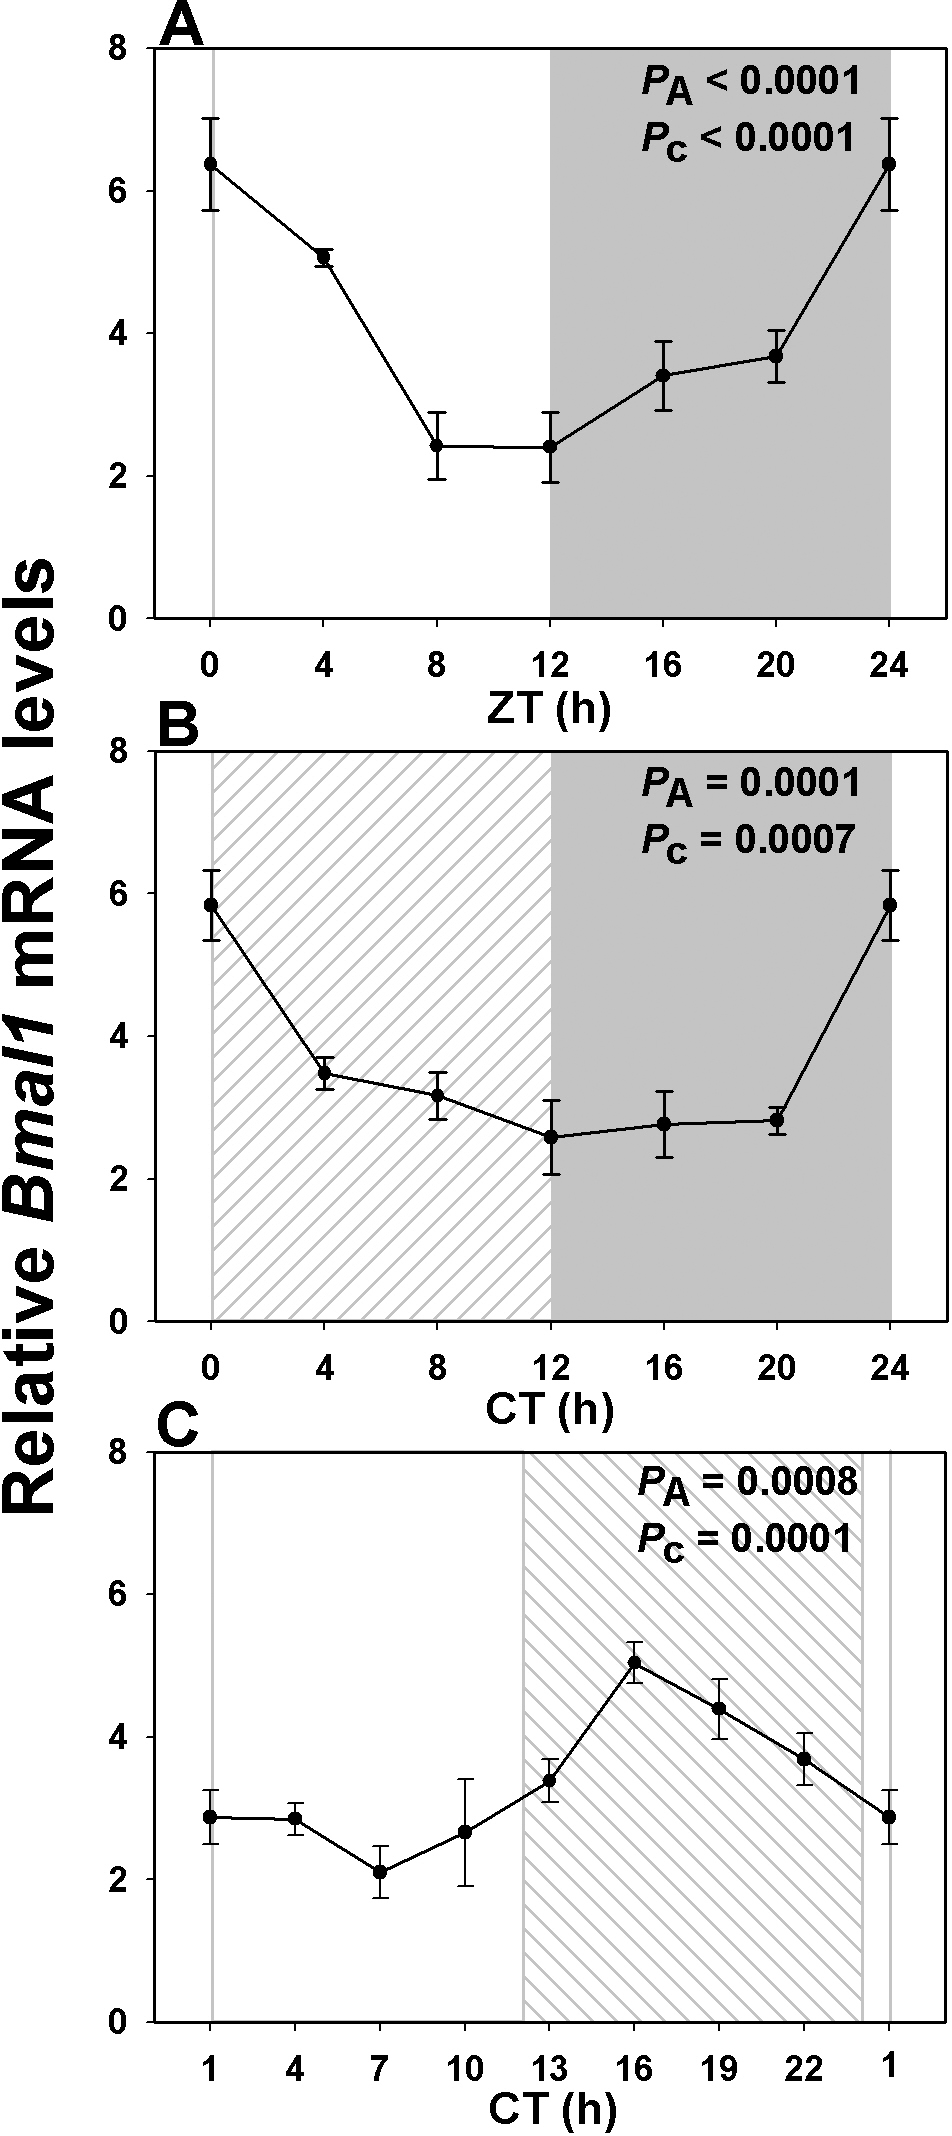
 Figure 6 of
Bobu, Mol Vis 2013; 19:1060-1073.
Figure 6 of
Bobu, Mol Vis 2013; 19:1060-1073.