Figure 3. Expression profile of cone vision-related genes over a single 24 h period under distinct lighting conditions. A, D, G: RNA expression levels of Opn1mws in a 12 h light: 12 h dark cycle (LD), in constant dark (DD) and in constant light (LL). B, E, H: RNA expression levels of Opn1sws in LD, DD and LL. C, F, I: RNA expression levels of Arr3 in LD, DD and LL. In LD (n=3–6 per time point) both Opn1mws and Opn1sws transcripts showed rhythmic patterns with maximal expression at or closely following the night/day transition, and a nadir
12 h later (A, B). Arr3 expression did not fit a cosinor function (C). The shapes of the curves were mostly similar under DD (D: Opn1mws, E: Opn1sws, F: Arr3; n=6 per time point). However, LL conditions led to large phase shifts, with maxima in the early to middle night (G: Opn1mws, H: Opn1sws, I: Arr3; n=4 per time point). Illumination conditions are depicted as solid white (day) and solid grey (night) areas in LD, right
hatched (subjective day) and solid grey (subjective night) areas in constant dark (DD) and solid white (subjective day) and
left hatched (subjective night) areas in constant light (LL). Animals were killed every 3 or 4 h over a 24 h period, and RNA
extracted from retinal tissue. RNA expression levels were quantified by real-time PCR. One-way analysis of variance (ANOVA)
and cosinor levels of significance (PA and Pc respectively) are given in the upper right corner of each panel.
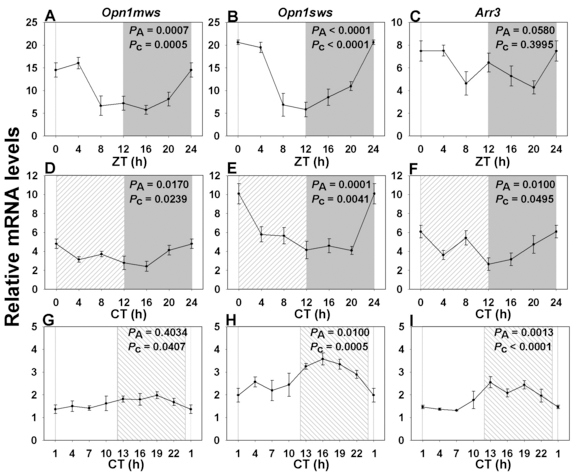
 Figure 3 of
Bobu, Mol Vis 2013; 19:1060-1073.
Figure 3 of
Bobu, Mol Vis 2013; 19:1060-1073.