Figure 2. Expression profile of rod-specific rhodopsin transcript over a single 24 h period under distinct lighting conditions. A: In a 12 h light: 12 h dark cycle (LD) a rhythmic pattern was observed with maximal expression close to “dawn” (night/day
transition), and a nadir 12 h later (n=3–6 per time point). B: Rhodopsin expression profile was similar in constant dark (DD; n=6 per time point). C: In constant light (LL) there was a large phase shift, such that peak values now occurred during the subjective night (CT19;
n=4 per time point). Illumination conditions are depicted as solid white (day) and solid gray (night) areas in LD, right hatched
(subjective day) and solid gray (subjective night) areas in DD, and solid white (subjective day) and left hatched (subjective
night) areas in constant light LL. Animals were killed every 3 or 4 h over a 24 h period, and RNA extracted from retinal tissue.
RNA expression levels were quantified by real-time PCR. One-way analysis of variance (ANOVA) and cosinor levels of significance
(PA and Pc respectively) are given in the upper right corner of each panel.
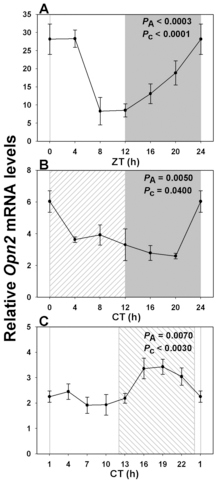
 Figure 2 of
Bobu, Mol Vis 2013; 19:1060-1073.
Figure 2 of
Bobu, Mol Vis 2013; 19:1060-1073.