Figure 1. Schematic diagram showing time schedule of experiments and sampling points. The bars show the paradigms used in light and
dark (LD) conditions (alternating white [light, 300 lux, 12 h] and black [dark, 12 h] bars]; DD (alternating right hatched
[subjective day] and black [subjective night] bars); and LL (alternating white [subjective day] and left hatched [subjective
night] bars]. Arrows indicate time points at which animals were killed and examined.
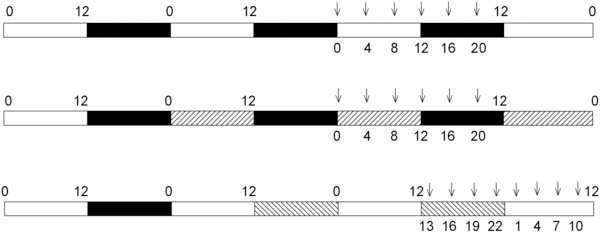
 Figure 1 of
Bobu, Mol Vis 2013; 19:1060-1073.
Figure 1 of
Bobu, Mol Vis 2013; 19:1060-1073.