Figure 5. Increased O-GlcNAcylation in retinal pericytes (PC) and endothelial cells (EC), but not astrocytes (AC), under high glucose
conditions. A: Protein lysates (25 µg) from retinal vascular cells were analyzed by western blot analysis for O-GlcNAcylated proteins and
expression of O-GlcNAc transferase (OGT) and O-GlcNAcase (OGA). B: The β-actin expression was assessed as a loading control and used for normalization and quantification of data obtained
from three different runs (B). Mean±SEM; *** (p≤0.001) significantly different from the 5 mM glucose control.
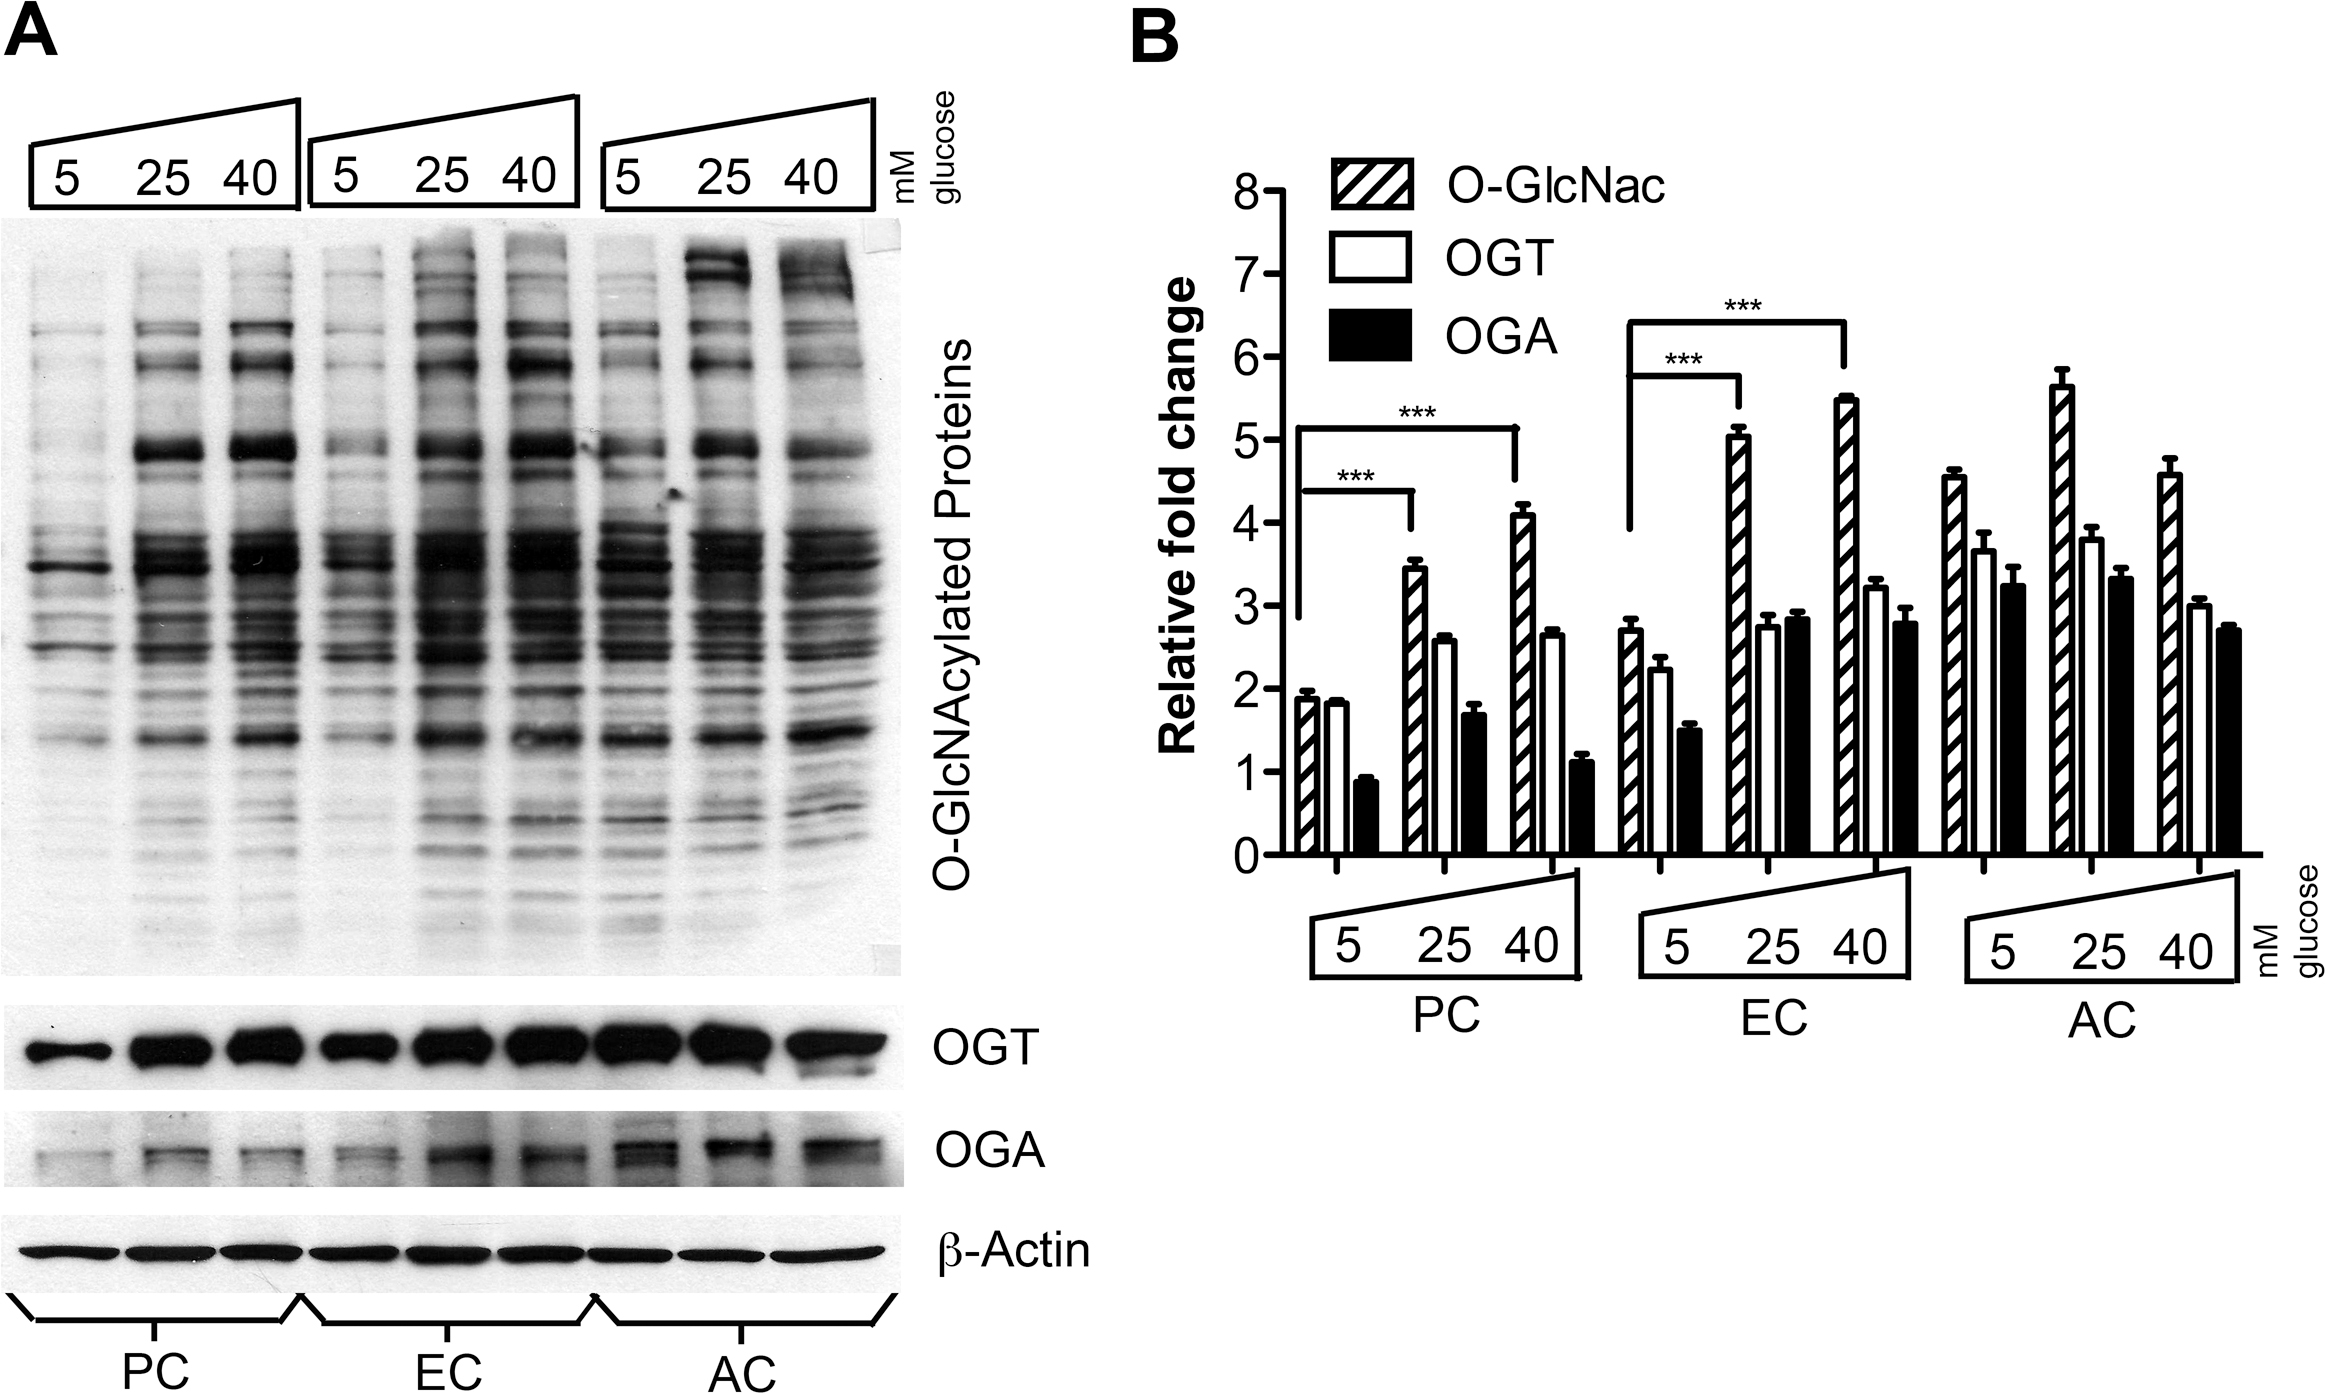
 Figure 5 of
Gurel, Mol Vis 2013; 19:1047-1059.
Figure 5 of
Gurel, Mol Vis 2013; 19:1047-1059.