Figure 3. O-GlcNAcylation increases during the neovascularization phase but decreases during the regression phase in an oxygen-induced
ischemic retinopathy (OIR) model. O-GlcNAc transferase (OGT) and O-GlcNAcase (OGA) expression did not show any correlation
with the alterations in O-GlcNAcylation. A: Retinal lysates (25 µg) from C57BL/6J mice during OIR were analyzed by western blot analysis for O-GlcNAcylated proteins
and expression of OGT and OGA. B: The β-actin expression was assessed as a loading control and used for normalization and quantification of data, which were
obtained after three different runs. C: RNA expression of OGT and OGA was determined by qPCR and normalized by RpL13A RNA expression in samples. The qPCRs were
performed with three biologic replicates and in triplicate. Mean±SEM; * (p≤0.05), ** (p≤0.01), and ***(p≤0.001) significantly
different from P7.
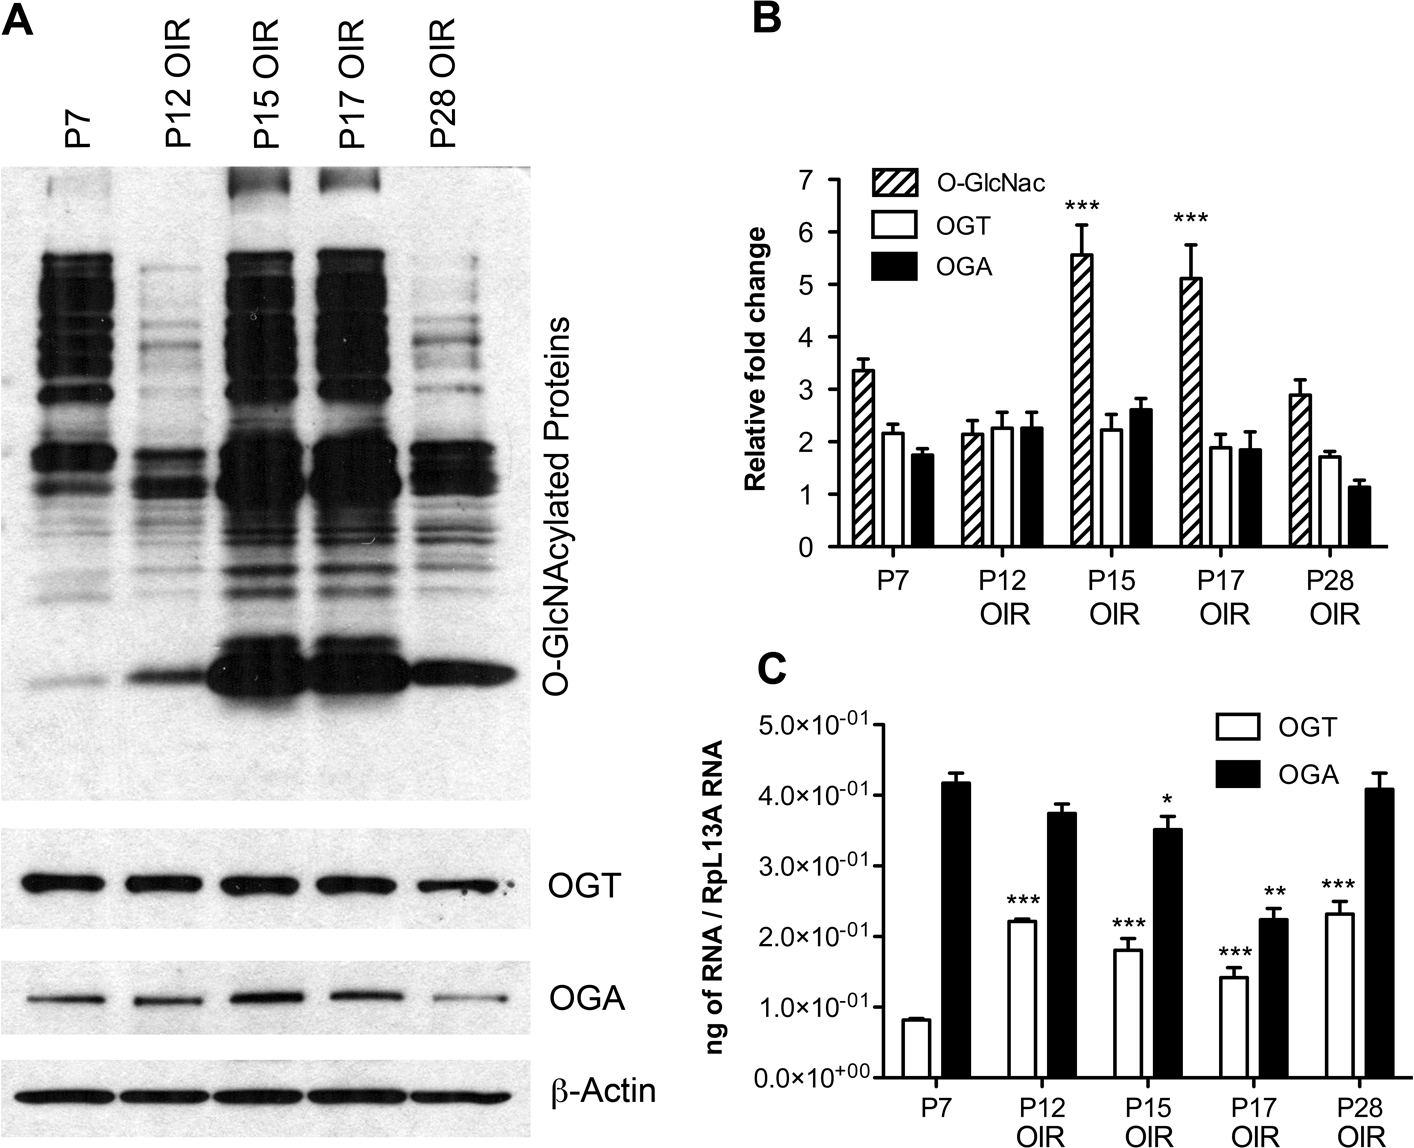
 Figure 3 of
Gurel, Mol Vis 2013; 19:1047-1059.
Figure 3 of
Gurel, Mol Vis 2013; 19:1047-1059.