Figure 2 of
Zhao, Mol Vis 2013; 19:1039-1046.
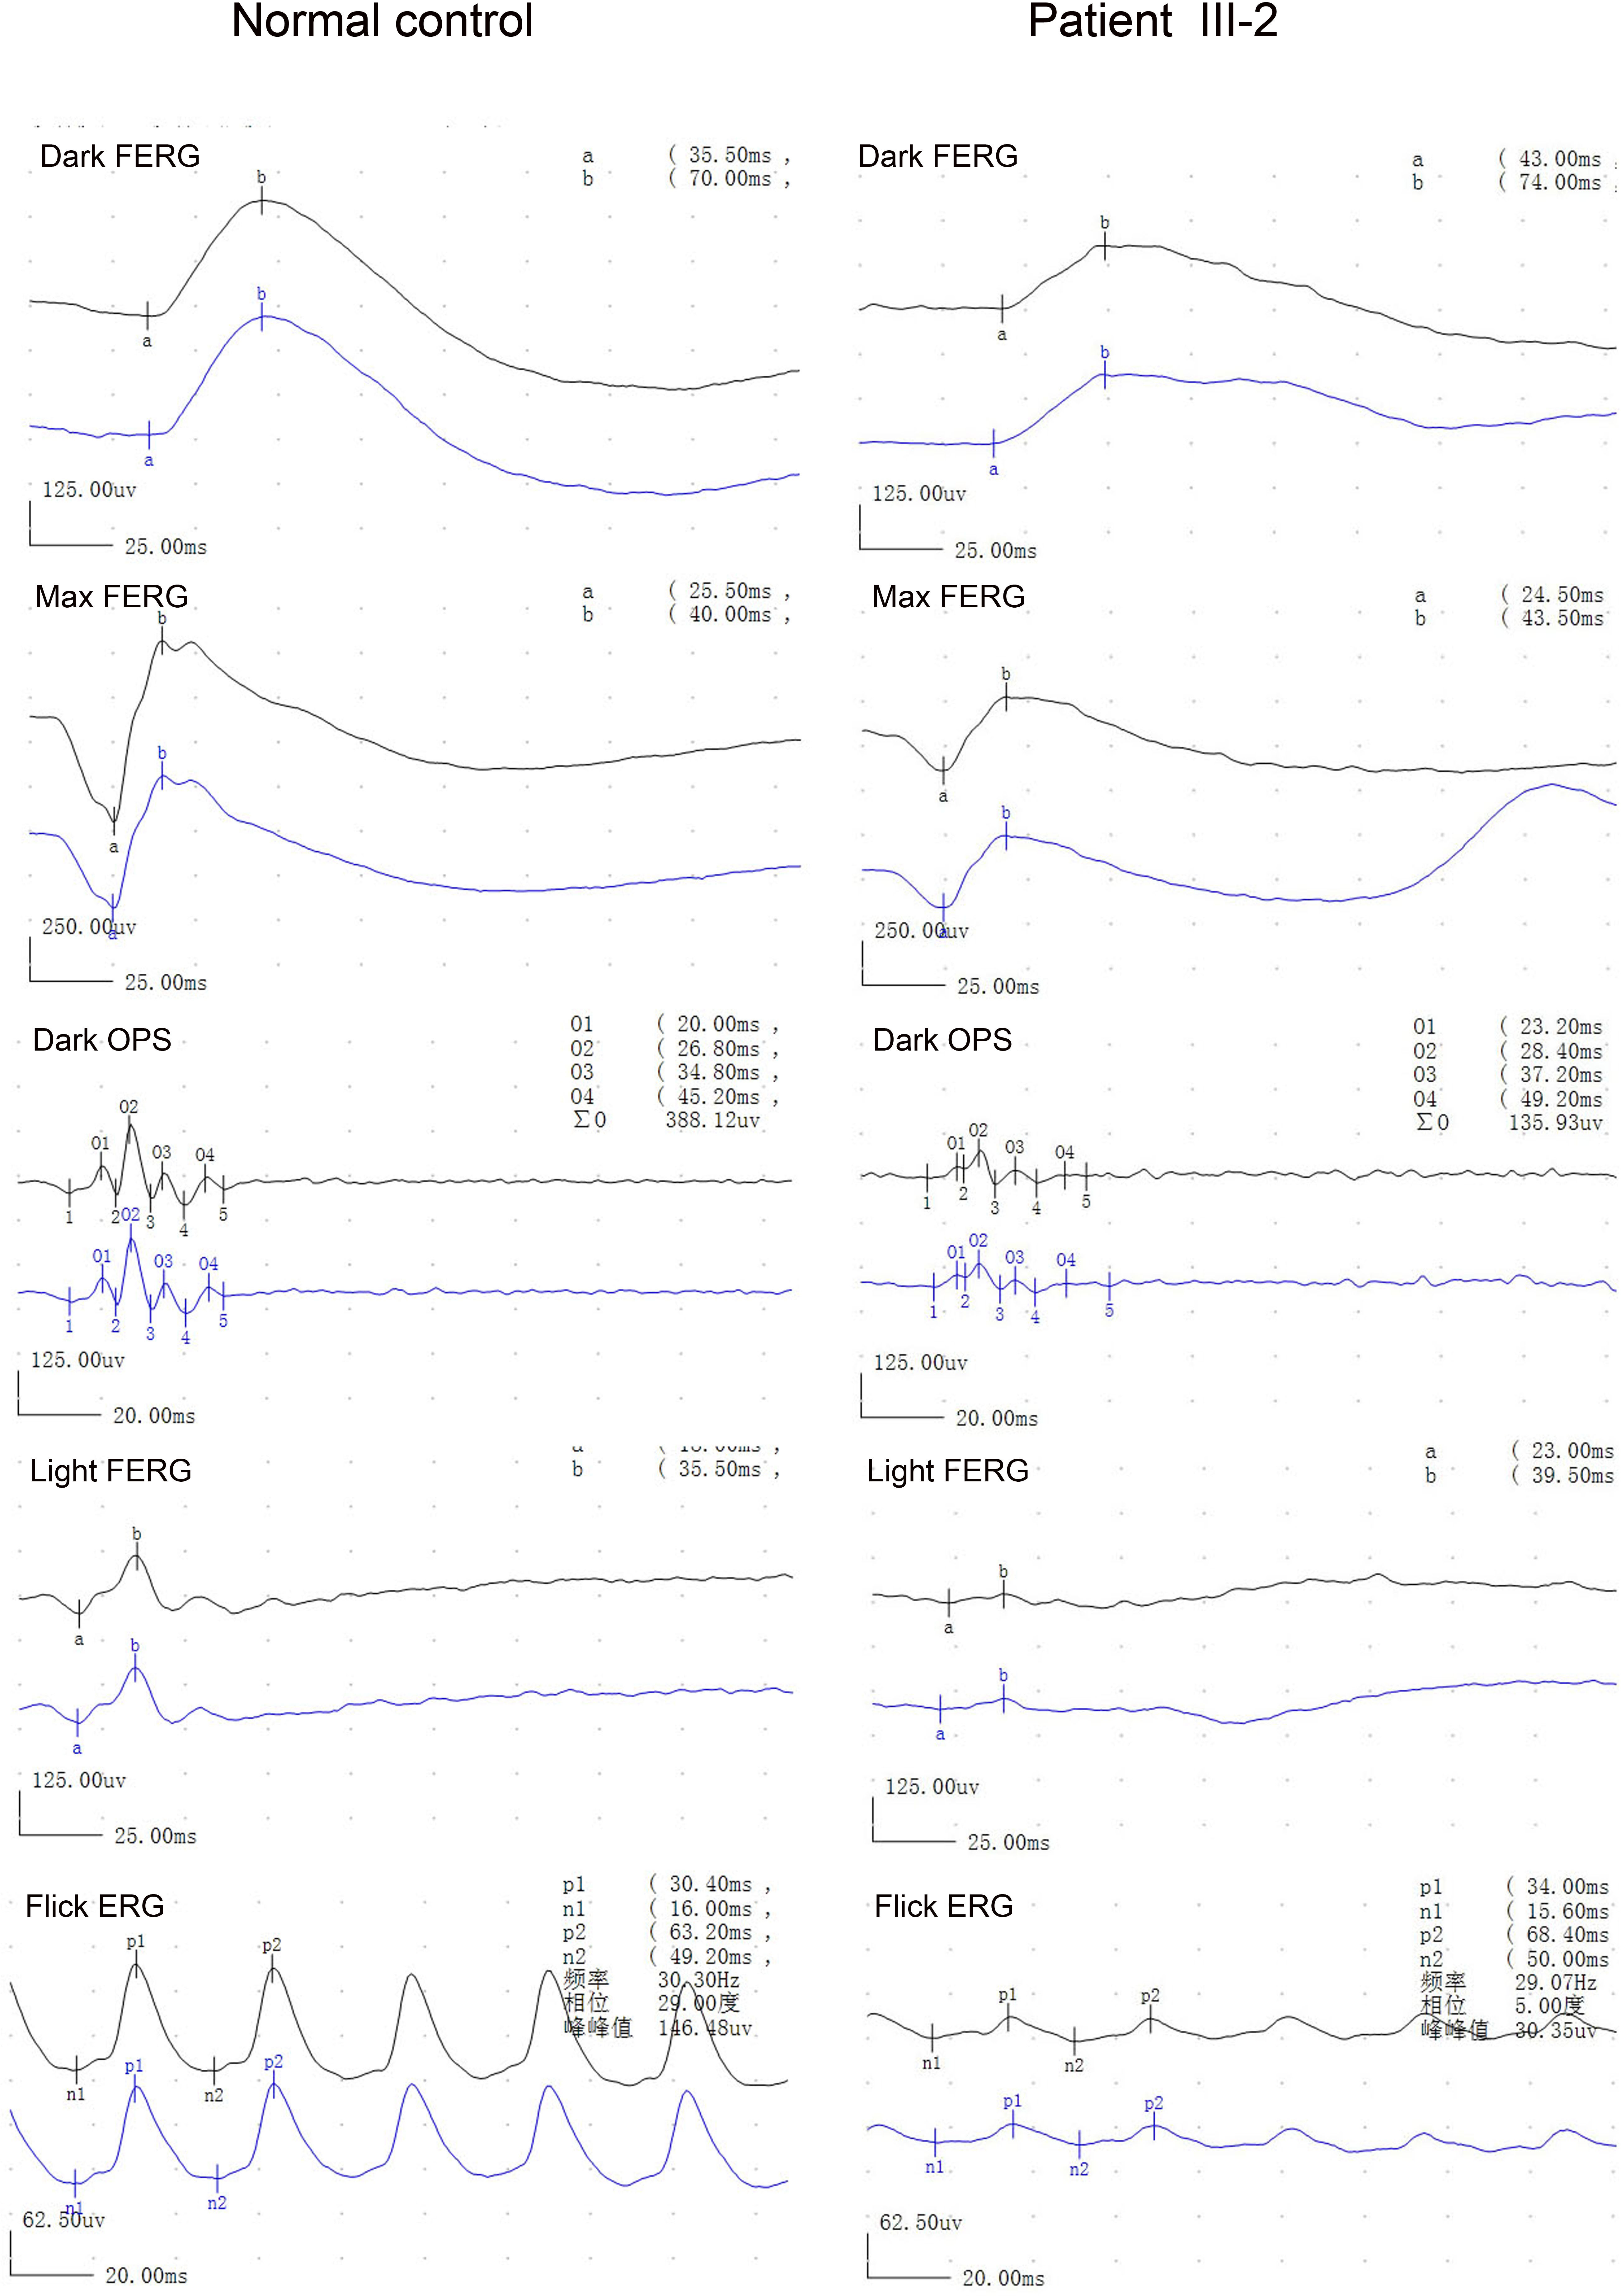
Figure 2.
Electroretinography of the proband and a normal control. Electroretinography of the proband shows reduced photopic and 30 Hz responses and normal scotopic responses.
 Figure 2 of
Zhao, Mol Vis 2013; 19:1039-1046.
Figure 2 of
Zhao, Mol Vis 2013; 19:1039-1046.