Figure 3 of
Chiras, Mol Vis 2013; 19:1006-1016.
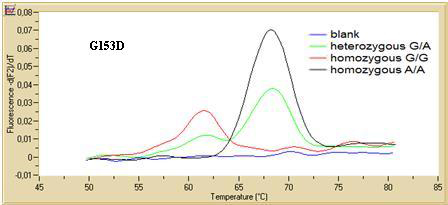
Figure 3.
Melting curve analysis for G153D single nucleotide polymorphism in channel F2 (for LC640 detection), for one heterozygous G/A, one homozygous G/G, and one homozygous A/A.
 Figure 3 of
Chiras, Mol Vis 2013; 19:1006-1016.
Figure 3 of
Chiras, Mol Vis 2013; 19:1006-1016.