Figure 2. Melting curve analysis for R141L single nucleotide polymorphism in channel F3 (for LC705 detection). A: Two peaks are shown for the two heterozygous G/T samples and one single peak for the homozygous G/G. B: Two peaks are shown for the homozygous T/T sample and one single peak for the homozygous G/G.
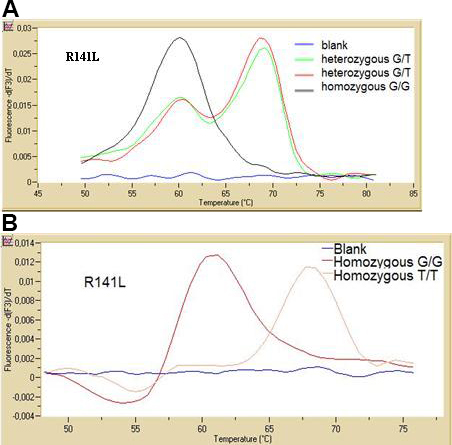
 Figure 2 of
Chiras, Mol Vis 2013; 19:1006-1016.
Figure 2 of
Chiras, Mol Vis 2013; 19:1006-1016.