Figure 7. Serum and peripheral blood mononuclear cell (PBMC) total thiol level. A: The bar column represents the mean±standard deviation (SD) of total serum thiol level (mmol/l) among the different study
groups. Total serum thiol levels were significantly decreased among nonproliferative diabetic retinopathy (NPDR; p<0.0001)
and proliferative diabetic retinopathy (PDR; p=0.0108) subjects in comparison to those considered as having diabetes without
retinopathy (DNR). The highest level of serum total thiol was found in healthy control (HC) subjects, even compared to the
DNR group (p=0.0428). However, no significant difference was observed in total serum thiol level among NPDR and PDR subjects
(p=0.0747). B: The bar columns represent the mean±standard deviation (SD) of PBMC total thiol levels (µmol/mg of protein) among the different
study groups. The PBMC total thiol level was decreased significantly among NPDR (p=0.0043) and PDR (p=0.0332) subjects than
those who were considered as DNR. The highest level of PBMC total thiol was found in HC subjects, even compared to the DNR
group (p=0.0105). However, no significant difference was observed in PBMC total thiol levels between NPDR and PDR subjects
(p=0.3568).
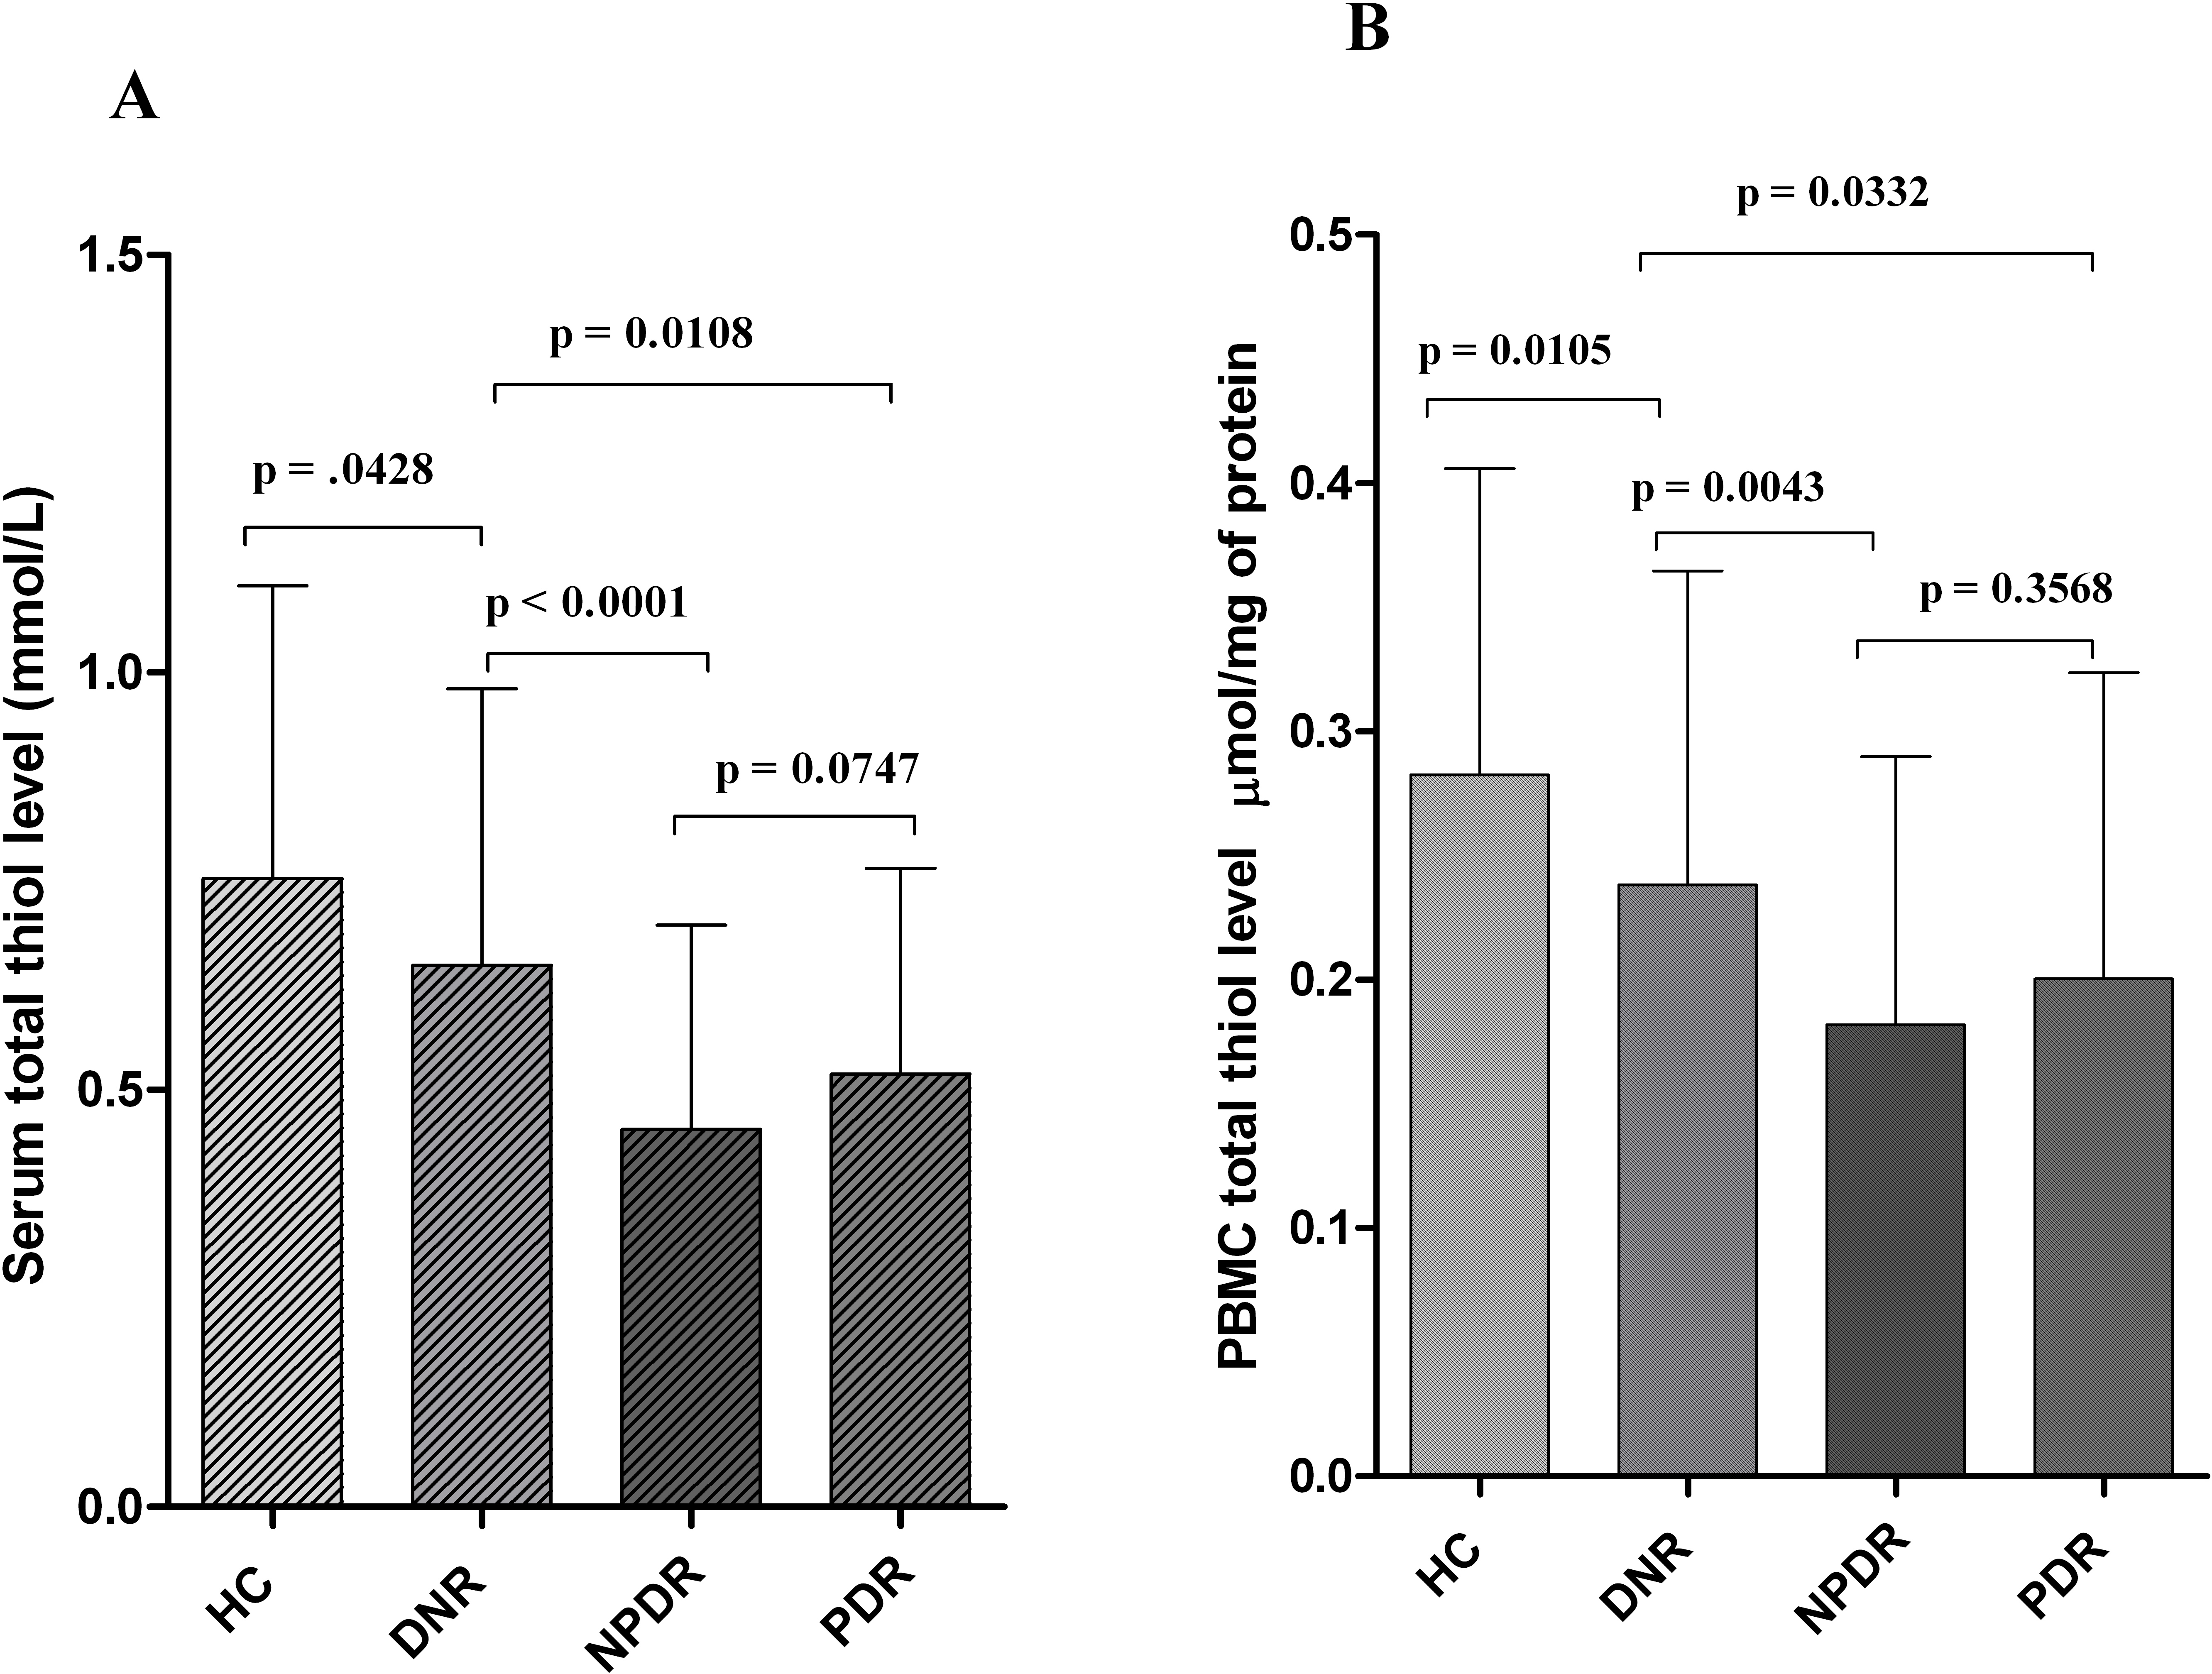
 Figure 7 of
Choudhuri, Mol Vis 2013; 19:100-113.
Figure 7 of
Choudhuri, Mol Vis 2013; 19:100-113.