Figure 6. Correlation between serum N – epsilon carboxy methyl lysine (Nε-CML) and ” and peripheral blood mononuclear cell reactive oxygen species (PBMC ROS) level. A, B, C, D: The XY scatterplot represents the correlation between serum Nε-CML levels and PBMC ROS levels among healthy control (HC), diabetic without retinopathy (DNR), nonproliferative diabetic
retinopathy (NPDR), and proliferative diabetic retinopathy (PDR) subjects. A significant correlation was observed in between
serum Nε-CML levels and PBMC ROS levels among NPDR (p<0.0001; r=0.5687) and PDR (p=0.0034; r=0.2863) subjects, but no significant
correlation was found in DNR (p=0.2344; r=0.1188) and HC individuals (p=0.3875; r=0.0896).
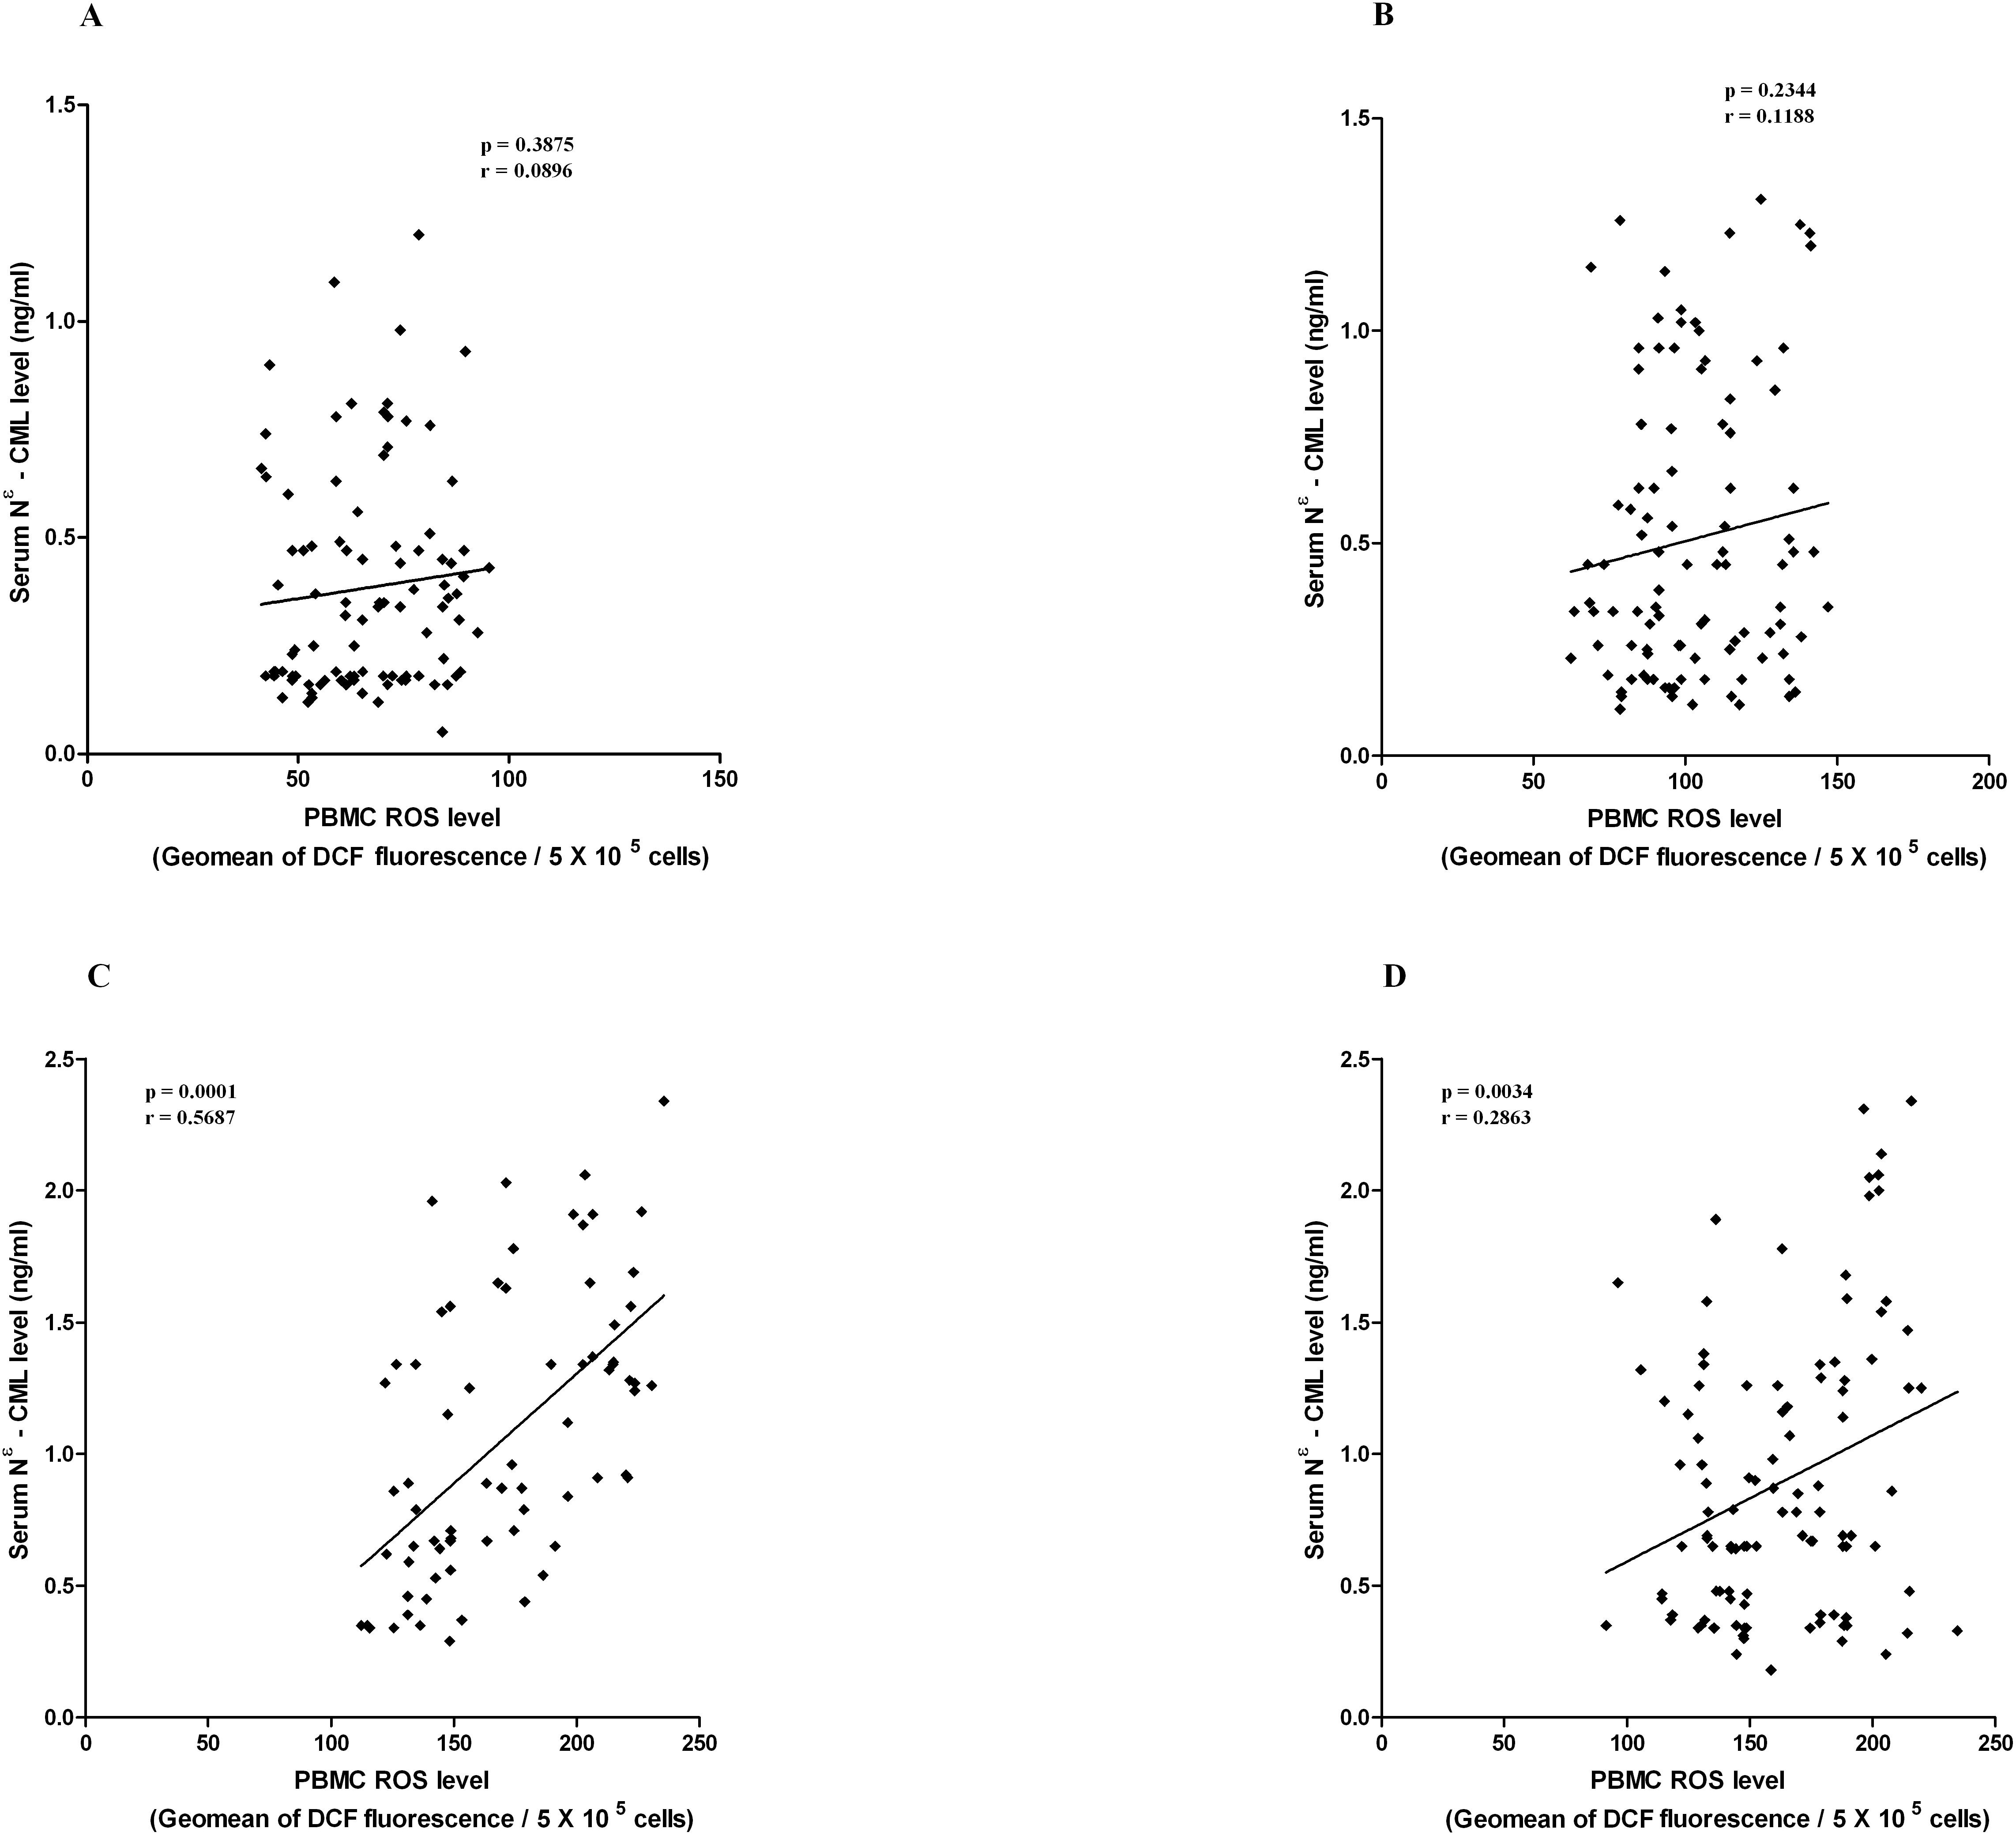
 Figure 6 of
Choudhuri, Mol Vis 2013; 19:100-113.
Figure 6 of
Choudhuri, Mol Vis 2013; 19:100-113.